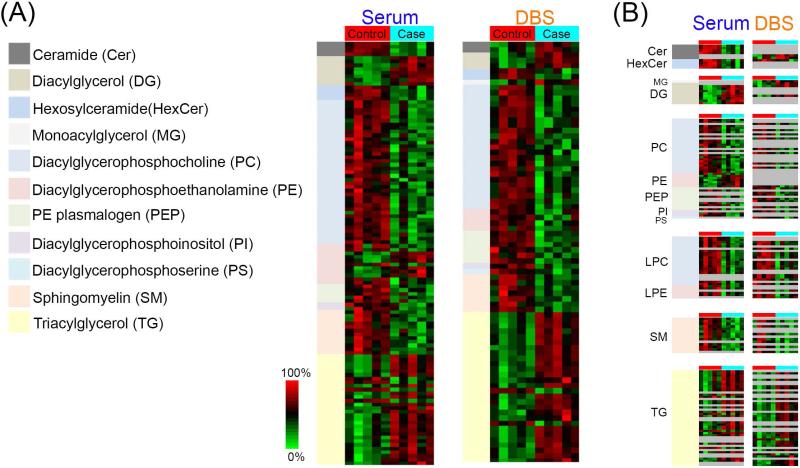
Figure 6.
(A) Heatmaps illustrating the lipid subclasses found to have statistically significant changes in the patient groups from the LC-MS/MS and LC-IMS-MS analyses. (B) A direct comparison of each statistically significant lipid subclass and individual lipid species in the serum and DBS samples.

