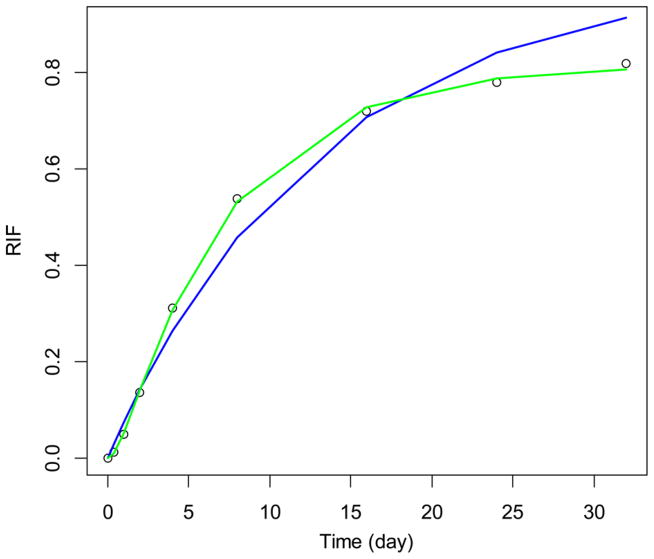
Figure 3.
Experimental (empty circles) data and model fits (green line, GP; blue line, exponential curve fitting) for mitochondrial trifunctional protein, subunit α (Q8BMS1). The GP produced a fit with RSS about 70 times smaller than that from the two-exponent fit.

