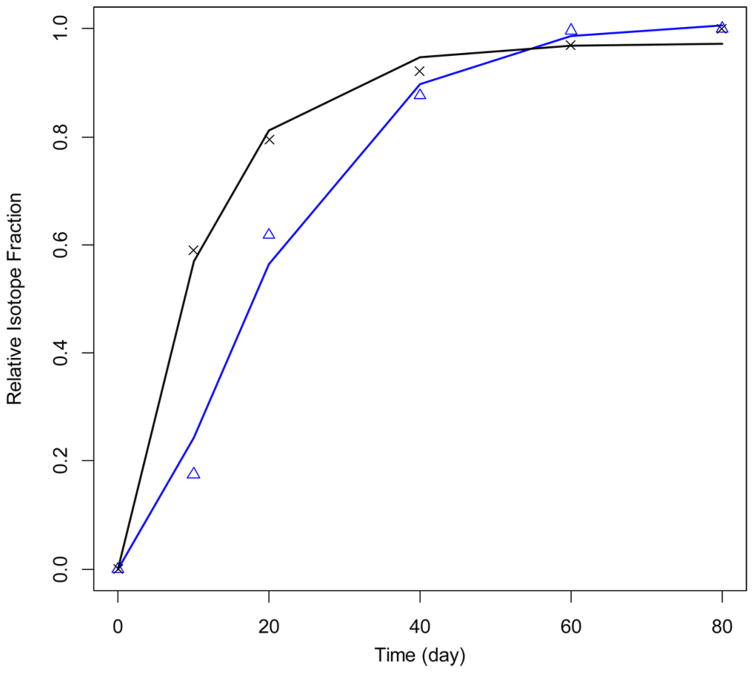
Figure 6.
GP modeling of RIF for CPT protein from normal (experimental data is shown with blue triangles and the fit in blue line) and induced heart failure (the experimental data is shown with black crosses and the fit in black line) interfebrullar mitochondria.41

