
Figure 2. Experimental workflow for systems-level proteomic profiling of TGF-β and TNFα signaling.
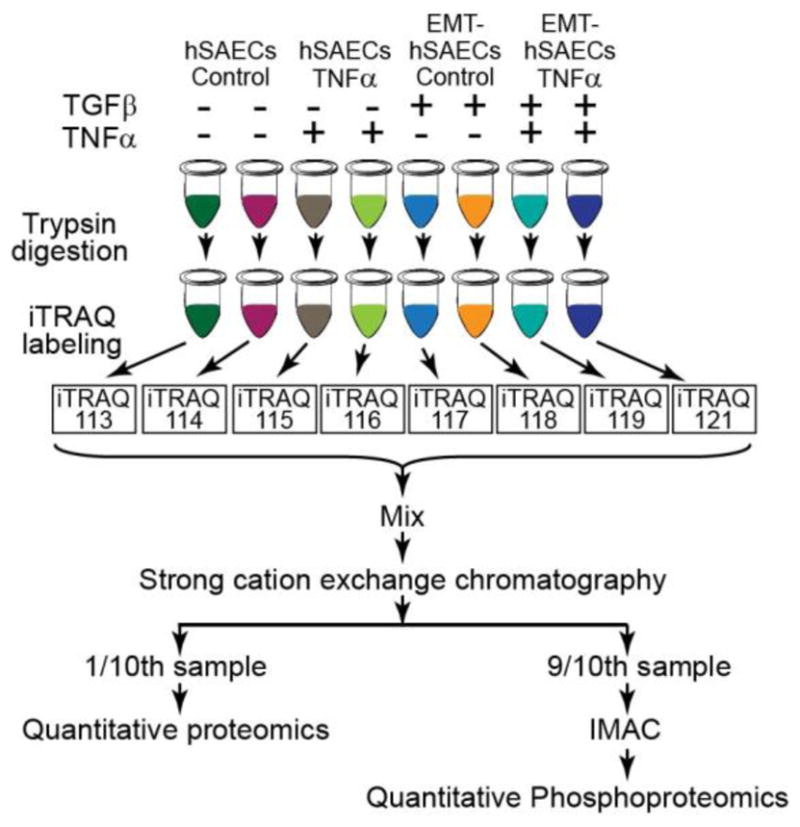
hSAECs cells were induced to EMT with TGFβ stimulation for 15 days. The hSAECs and EMT-hSAECs cells were stimulated with TNFα. After stimulation, cells were lysed, digested with Lys-C/trypsin and labeled with 8-plex iTRAQ reagents. Samples were mixed and separated via SCX. 90% of total peptides in each SCX fraction were further enriched for phosphopeptides with IMAC, whereas 10% of total peptides were used for quantitative proteomic profiling. All samples were analyzed by Q Exactive Orbitrap mass spectrometer. The proteins and phosphoproteins were identified and quantified with Proteome Discoverer.