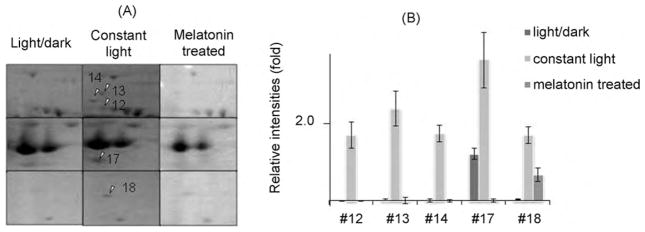
Fig. 4.
2D-SDS-PAGE and quantitative analysis of the target proteins. (A) Magnified gel images with arrows showing five proteins, up-regulated by constant light and down-regulated by melatonin. #12, vimentin; #13, serine/threonine-protein phosphatase 2A; #14, Rab GDP dissociation inhibitor alpha; #17, guanine nucleotide-binding protein; #18, retinaldehyde-binding protein. Left panel: cyclic light/dark; middle panel: constant light; right panel: constant light and melatonin. (B) Semi-quantitative analysis of five proteins. Number indicates the relative intensity of each spot. Values are shown in mean ± SD (n = 3).

