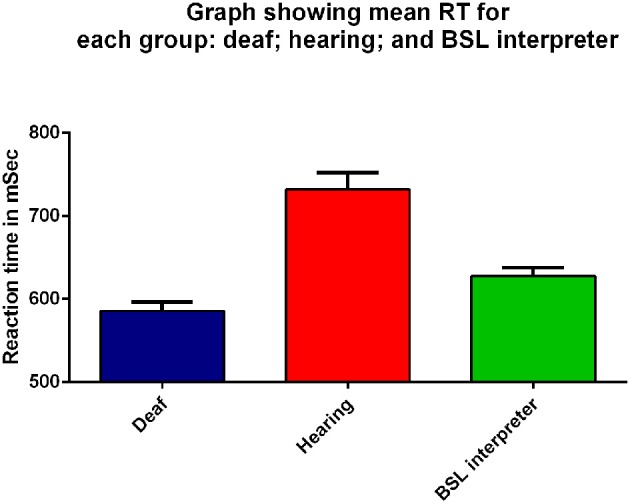
Figure 2.

Mean RT (ms) for all peripheral visual stimuli presented to the right eye for the three groups: deaf (dark blue), hearing (red), and BSL interpreter (green) on the x-axis. Error bars denote standard error of the mean (SEM). Each group was significantly different from the other two groups (p ≤ 0.03) on Bonferroni post-hoc analyses.
