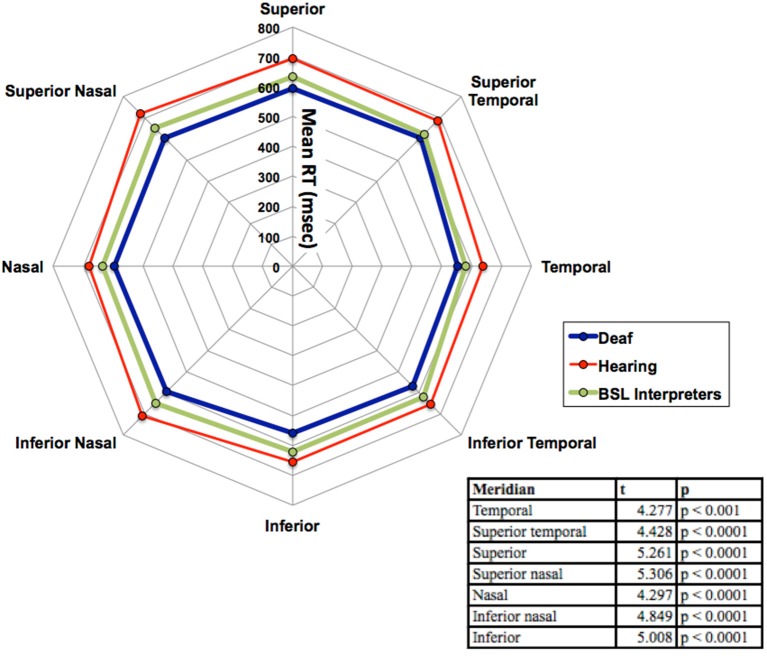
Figure 3.
Mean RT in ms for the three groups (deaf, hearing and BSL interpreter) for the eight meridian locations. The table within the figure shows the results of the Bonferroni post-hoc analyses with df = 33 for each reported value. Significant differences were found at each meridian location only between deaf and hearing groups. For clarity, no error bars are shown, but the SEM was between 10 and 17 ms.

