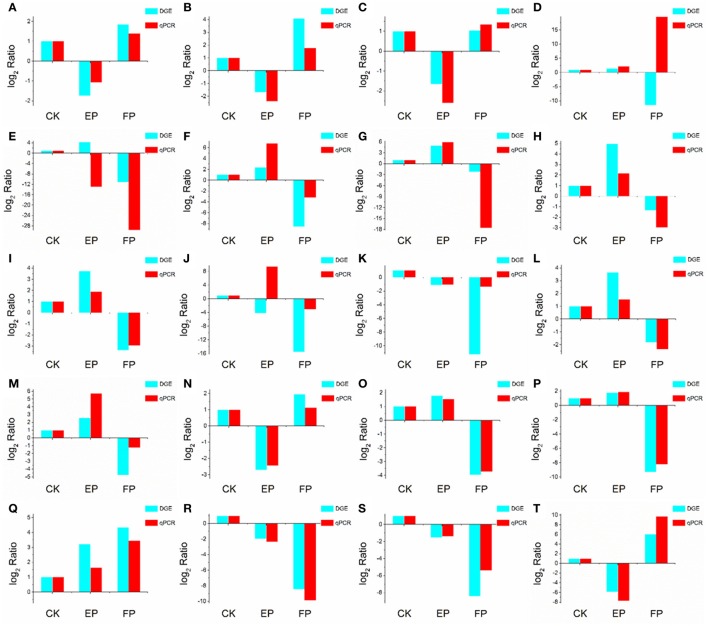
Figure 8.
Confirmation of DEGs by qRT-PCR. The x-axis indicates treatment method. The y-axis indicates relative expression level. The following genes were tested (with description). (A) glutaminase a (Unigene11948_A), (B) probable lysosomal cobalamin transporter (Unigene16976_A), (C) NAD(P)-binding protein (Unigene17203_A), (D) putative alcohol dehydrogenase (Unigene6694_A), (E) cytochrome P450 monooxygenase (Unigene14342_A), (F) beta-glucosidase (Unigene19402_A), (G) pyruvate decarboxylase (Unigene13421_A), (H) cyanide hydratase (Unigene13743_A), (I) major facilitator superfamily transporter (CL403.Contig1_A), (J) glycoside hydrolase family 72 protein (Unigene7006_A), (K) transmembrane amino acid transporter (Unigene19132_A), (L) epl1 protein (Unigene2645_A), (M) heavy metal translocating P-type ATPase (Unigene13596_A), (N) glutathione S-transferase Gst3 (Unigene2773_A), (O) phosphoadenosine phosphosulfate reductase (Unigene7219_A), (P) nucleolar protein nop-58 (CL1651.Contig1_A), (Q) laccase-like protein (Unigene11698_A), (R) high affinity copper transporter (Unigene9769_A), (S) 3-ketoacyl-CoA reductase (Unigene3887_A), (T) glucan 1,4-alpha-maltohexaosidase (Unigene17276_A).

