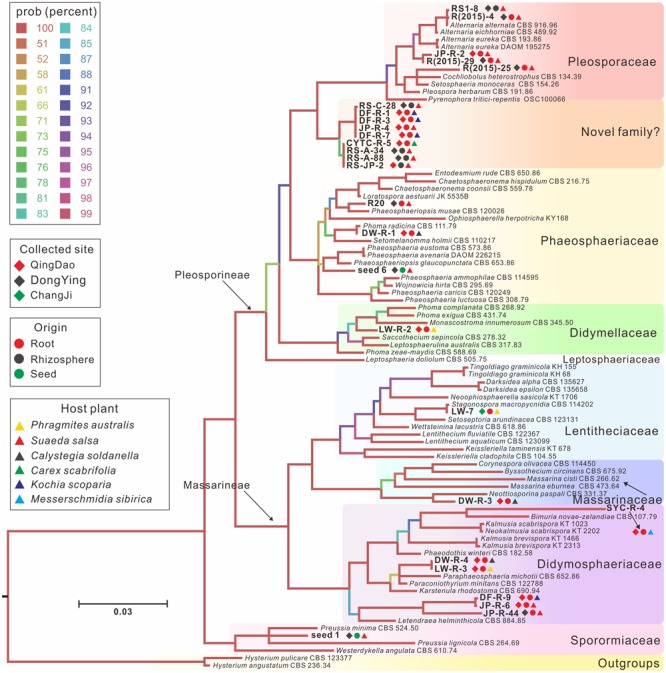
FIGURE 2.

A majority rule Bayesian phylogram showing the relationships between our isolates and currently described pleosporalean fungi, based on the concatenated alignment of orthologous genes encoding ribosomal RNAs from two subunits, the large subunit (LSU) and small subunit (SSU), and a large fragment of the transcription elongation factor 1-α gene (tef1). The color of branch corresponded to the posterior probabilities percentage. Accession numbers of the three genes used for the phylogram were given in Table 1 and Supplementary Table S1. Different symbols showing collection sites, origin materials and host plants for each isolate were also indicated.
