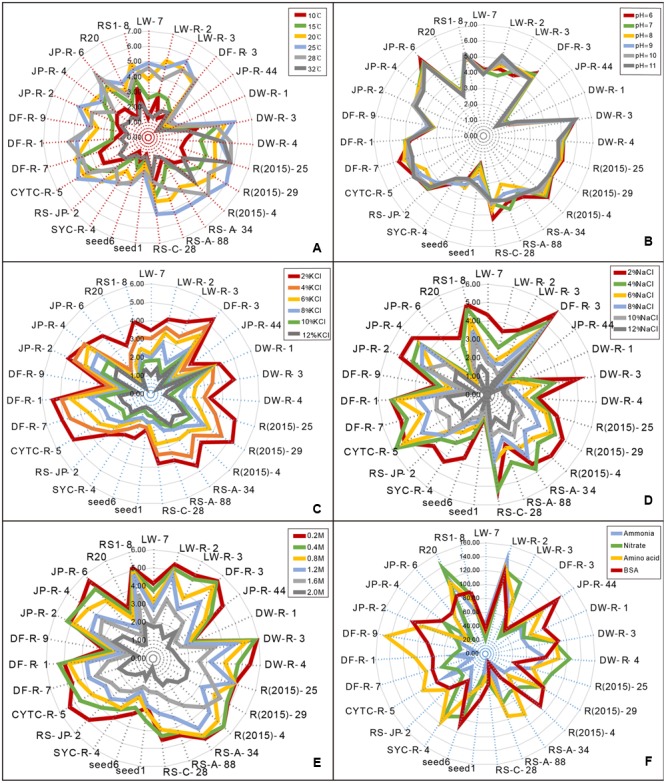
FIGURE 3.

Radar charts showing the different sensitivity of pleosporalean fungal growth to diverse stress conditions and their nitrogen utilization pattern. Fungal growth was estimated by measured parameters of diameter on PDA plates (for stress assays) or dry weight of the biomass production in liquid medium (for nitrogen utilization assay). (A) Effects of different temperature on the growth of the isolates. (B) Effects of different pH level on the growth of the isolates. (C,D) Effects of a range of salt (NaCl and KCl) concentrations on the growth of the isolates. (E) Effects of the non-ionic osmotic stress (sorbitol) on the growth of the isolates. (F) Variable nitrogen utilization pattern. (NH4)2HPO4 and KNO3 were used as inorganic N, while a mixture of amino acids and Bovine Serum Albumin (BSA) as organic N.
