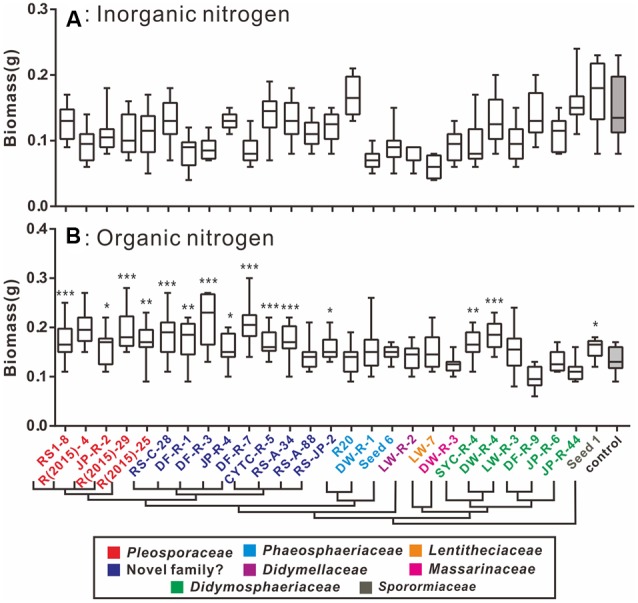
FIGURE 4.

Box-plots showing the plant biomass of fungal-treated and control groups supplied with inorganic (A) and organic nitrogen (B). (A) In the presence of inorganic N, the majority of isolates had non-significant positive influences on the biomass of the seedlings compared to the uninoculated control group. (B) In the presence of organic N, significant differences to the control in biomass were evaluated for the seedlings inoculated with the tested isolates, which were denoted by ∗P < 0.05, ∗∗P < 0.01, ∗∗∗P < 0.0001. Horizontal bars within the box indicated the median value of the data, and the outer vertical bars represented the maximum and minimum values of the data. A cluster tree modified from Figure 2 was added to clarify the linkage between the phylogeny within the fungal isolates and their functions.
