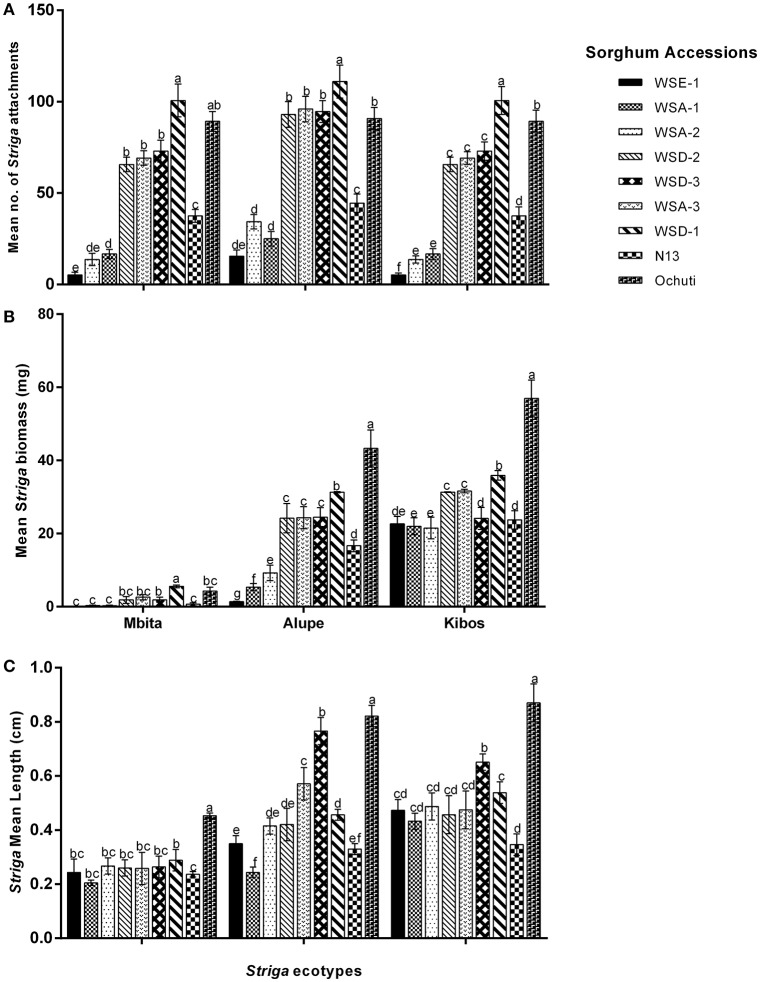
Figure 2.
Resistance response of sorghum accessions to Striga hermonthica: (A) Mean Striga attachments; (B) Mean bioass of Striga plants; (C) mean Striga length on wild sorghum accessions using 3 ecotypes of Striga. The number of Striga plants was measured 21 days after infection of sorghum roots with S. hermonthica seeds. Vertical bars represent the mean ±SD while letters represent mean separations at p ≤ 0.05. The values given represent the mean for each plant.

