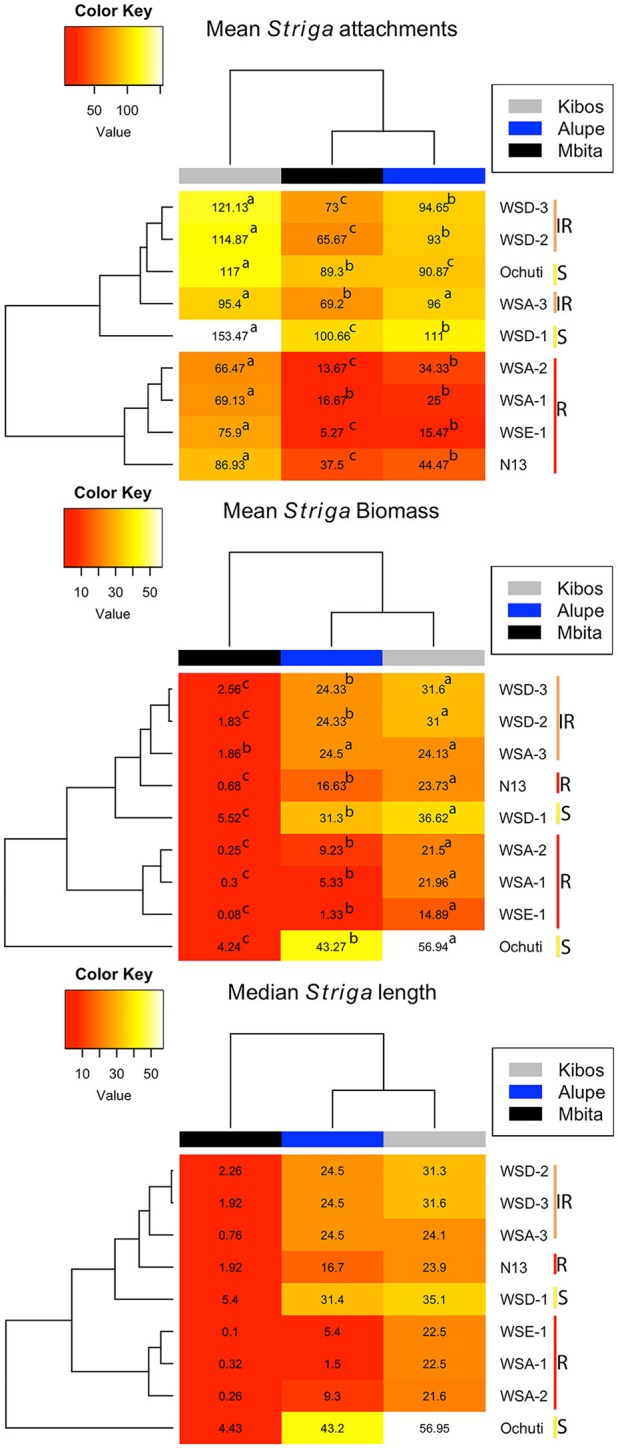
Figure 3.

Heatmaps (generated using mean Striga attachments, biomass and median Striga length) showing levels of resistance of sorghum accessions infected with Striga seedlings. The yellow bar labeled “S” (Ochuti and WSD-1) represents the most susceptible accessions, and the orange bar labeled “IR” is a group consisting of WSA-3, WSD-2, and WSD-3 that had intermediate resistance, while the red bar labeled “R” represents the most resistant group, which consists of WSA-1, WSA-2 WSE-1, and N13. The heatmaps also provide an indication of the virulence of Striga ecotypes. More attachments, more biomass and longer Striga seedlings formed from Kibos and Alupe ecotypes compared to Mbita. The letters indicate significance differences between ecotypes on the same accession at p < 0.05.
