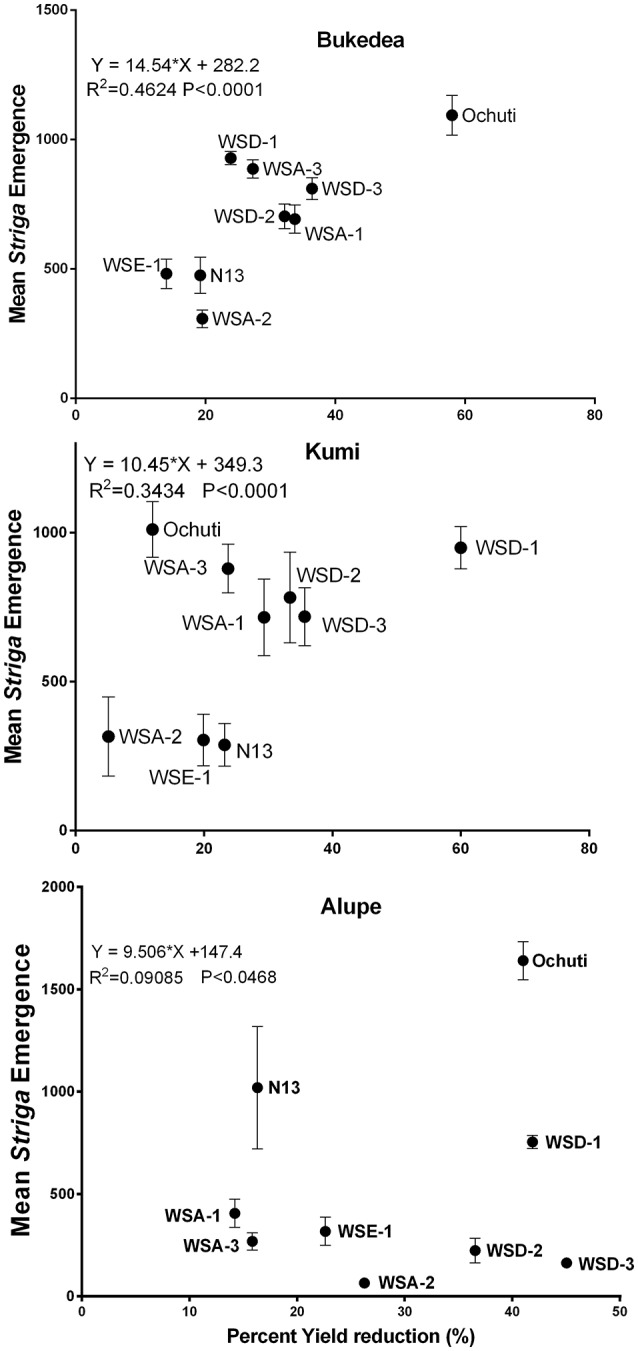
Figure 8.

Correlation of Striga emergence to percentage yield loss at the three sites. The vertical axis represents mean emergence (AUSPNC) at 86 days after planting while the horizontal axis represents the percentage yield loss expressed as a yield loss between Striga-free fields and yield in Striga-infested fields as a function of yield in a Striga-free field. The data are presented as the means ± SD.
