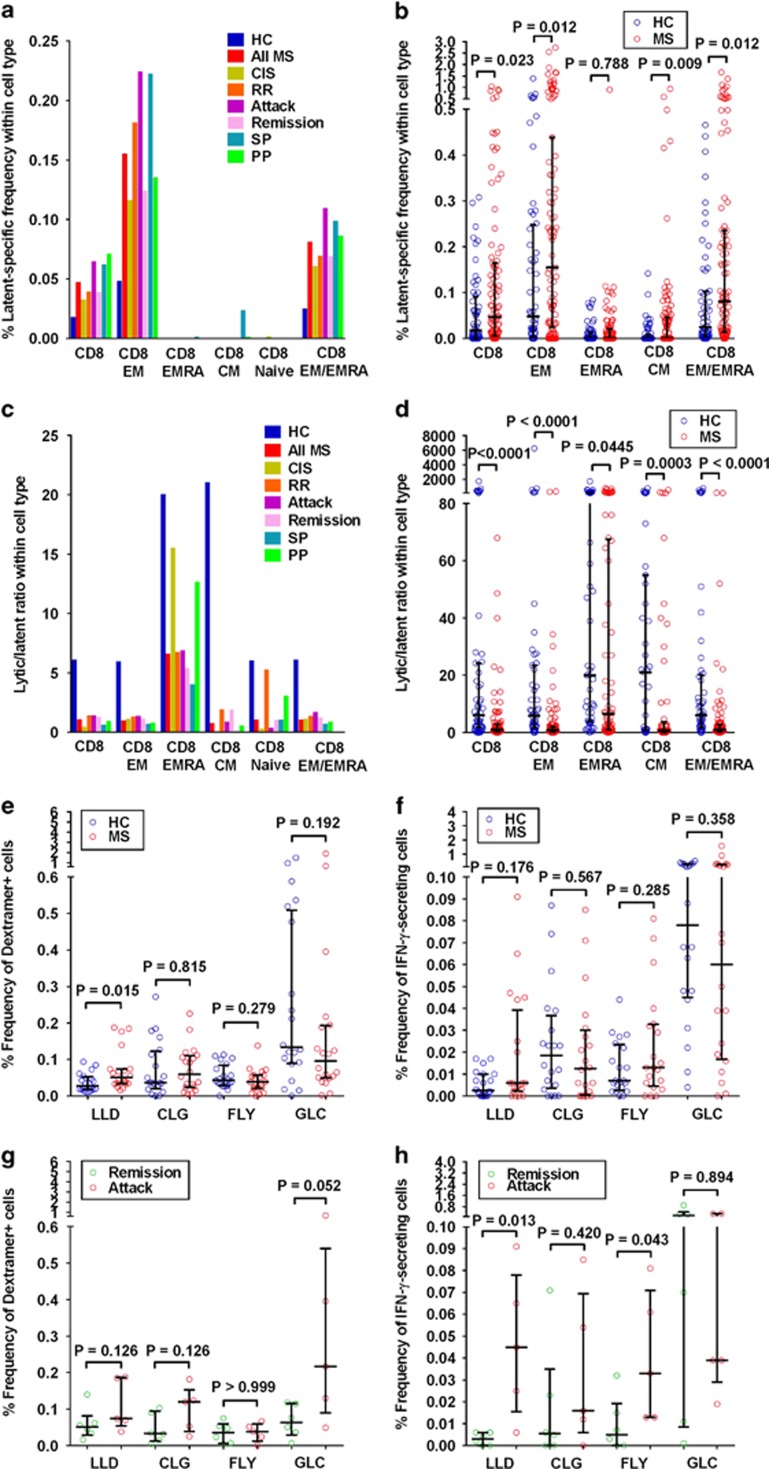
Figure 4.
Skewing of the EBV-specific CD8+ T-cell response in MS away from lytic to latent antigens. (a) Median percentages of CD8+ T cells within the different phenotypes producing IFN-γ in response to a pool of HLA-class-I-restricted EBV latent peptides in EBV-seropositive healthy controls (HC), the total group of MS patients (All MS), patients with clinically isolated syndrome (CIS), patients with relapsing–remitting (RR), secondary progressive (SP) and primary progressive (PP) MS, as well as patients during a clinical attack (Attack) and during remission (Remission). As expected, there was no CD4+ T-cell response to these HLA-class-I-restricted peptides. (b) Percentages of latent-specific cells within the CD8+, CD8+ EM, CD8+ EMRA, CD8+ CM and CD8+ EM/EMRA T-cell populations in patients with MS (MS) compared with healthy controls (HC) (medians with interquartile ranges indicated by black horizontal lines), with bracketed P-values determined by the Mann–Whitney test. (c) Median lytic/latent ratio within the different phenotypes in EBV-seropositive HC, the total group of MS patients (All MS), patients with CIS, patients with RR, SP and PP MS, as well as patients during a clinical attack (Attack) and during remission (Remission). For each subject the ratio was calculated by dividing the frequency of CD8+ T cells producing IFN-γ in response to pooled lytic peptides by the frequency of CD8+ T cells producing IFN-γ in response to pooled latent peptides. (d) Lytic/latent ratio within the CD8+, CD8+ EM, CD8+ EMRA, CD8+ CM and CD8+ EM/EMRA T-cell populations in the total group of MS patients (MS) compared with HC (medians with interquartile ranges indicated by black horizontal lines), with bracketed P values determined by the Mann–Whitney test. (e and f) Percentages of T cells specific for individual EBV latent (LLD, CLG and FLY) and lytic (GLC) peptides in the CD8+ population in 20 HLA-A*02+ EBV-seropositive healthy subjects (HC) and 20 HLA-A*02+ MS patients (MS) measured by binding to peptide-HLA-A*02 Dextramers (e) and IFN-γ production (f) (medians with interquartile ranges indicated by black horizontal lines), with bracketed P-values determined by the Mann–Whitney test. (g and h) Percentages of T cells specific for individual EBV latent and lytic peptides in the CD8+ population in HLA-A*02+ patients during clinical attacks (Attack) or during remission (Remission) measured by binding to peptide-HLA-A*02 Dextramers (g) and IFN-γ production (h) (medians with interquartile ranges indicated by black horizontal lines), with bracketed P-values determined by the Mann–Whitney test.

