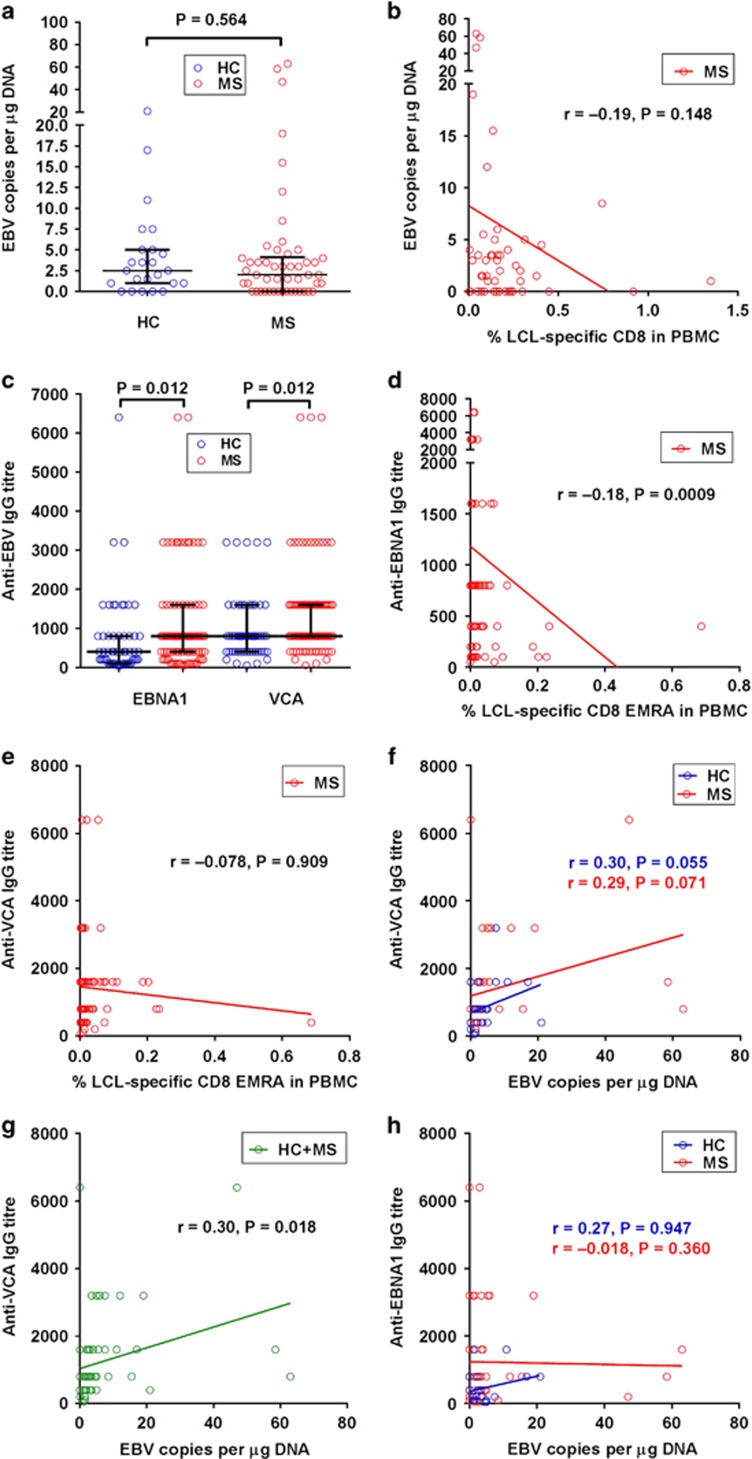
Figure 6.
The relationships of EBV genome load and anti-EBV antibody titres with the frequency of EBV-specific CD8+ T cells in MS. (a) EBV DNA copy number in the PBMC in healthy EBV-seropositive subjects (healthy controls (HC)) and patients with MS (MS) (medians with interquartile ranges indicated by black horizontal lines), with P-value determined by the Mann–Whitney test. (b) Relationship between the EBV genome load and the LCL-specific CD8+ T-cell frequency in MS patients. (c) Titres of anti-EBNA1 IgG and anti-VCA IgG in the sera of healthy EBV-seropositive subjects (HC) and patients with MS (MS) (medians with interquartile ranges indicated by black horizontal lines), with bracketed P-values determined by the Mann–Whitney test. (d) Relationship between the anti-EBNA1 IgG titre and the LCL-specific CD8+ EMRA T-cell frequency in the PBMC in MS patients. (e) Relationship between the anti-VCA IgG titre and the LCL-specific CD8+ EMRA T-cell frequency in the PBMC in MS patients (f) Relationship between the anti-VCA IgG titre and the EBV genome load in HC and patients with MS (MS). (g) Relationship between the anti-VCA IgG titre and the EBV genome load in the combined groups of HC and patients with MS. (h) Relationship between the anti-EBNA1 IgG titre and the EBV genome load in HC and patients with MS.

