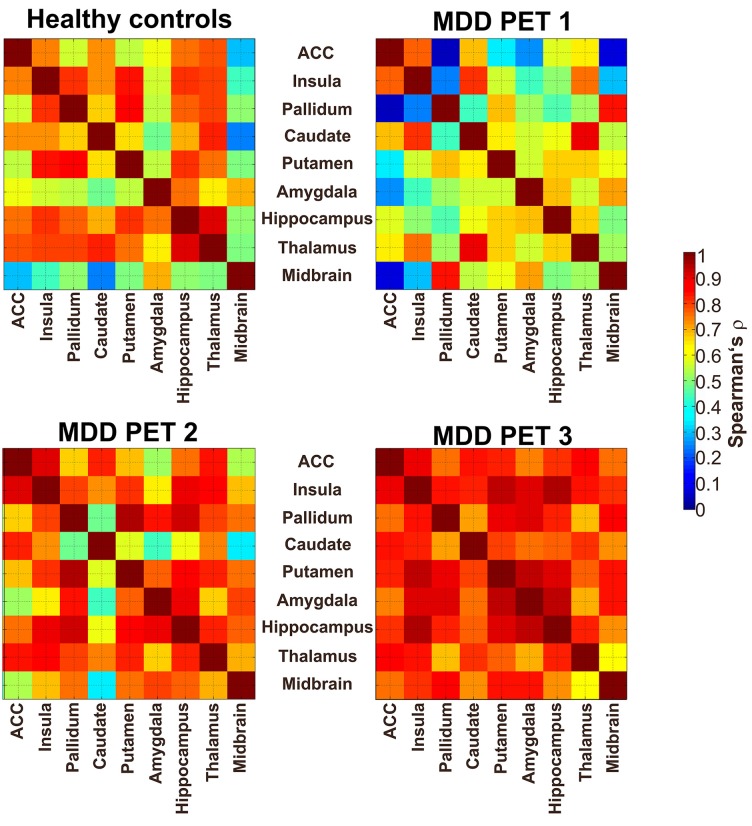
Figure 2.
Interregional SERT correlation matrices between nine regions of interest (ROIs). The upper left map shows the correlation (Spearman’s ρ) of SERT binding in HC. The upper right map displays the condition of depressive patients at baseline (PET 1; unmedicated), the lower left and lower right maps show the SERT availability after 6 h (PET 2) and after 3 weeks of oral SSRI treatment (PET 3), respectively. ACC, anterior cingulate cortex; the color table indicates the molecular interregional relation between regions, given in Spearman’s rho (ρ).

