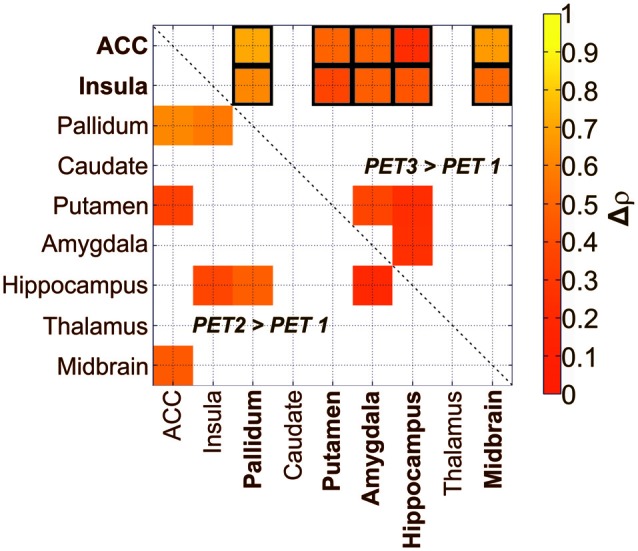
Figure 3.

Treatment-induced changes in the relation of SERT availability in depressive patients after administration of SSRI in two different treatment conditions (PET 2, PET 3) compared to baseline (PET 1). The lower triangle denotes significant increases in relations after a single oral SSRI dose in depressive patients (p < 0.05; uncorrected). The upper triangle shows significant increases after 3 weeks of treatment (p < 0.05; uncorrected). Framed squares indicate changes which remain significant after FDR correction for multiple comparison at p < 0.05. ACC, anterior cingulate cortex; the color table indicates changes in correlation coefficients (Δρ).
