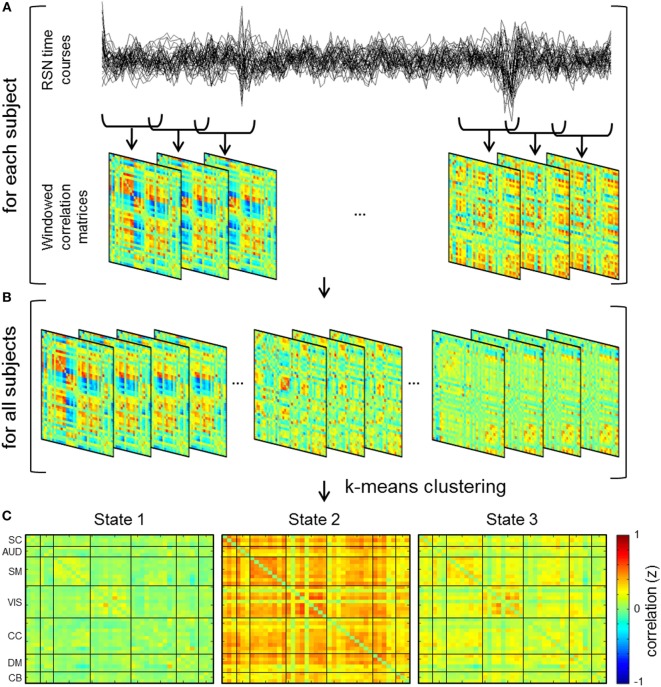
Figure 3.
Schematic depicting dynamic functional network connectivity (dFNC) analyses. (A) dFNC analysis computes functional network connectivity on windows of the independent component time courses and hence windowed correlation matrices are generated for each subject. (B) Concatenation of dFNC windows for all subjects and subsequent k-means clustering of the windows results in cluster centroids or connectivity states. (C) dFNC cluster centroids for 44 s window.

