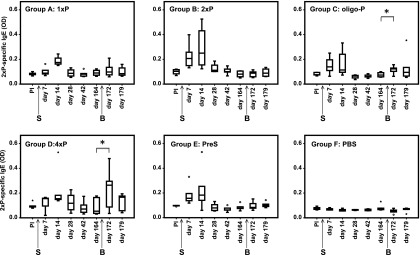
FIGURE 6.
Peptide-specific IgE Ab levels over time in groups of mice (groups A–F). Shown are IgE levels specific for 2xP (y-axes, OD values as box plots with indicated medians) measured before and at different days after sensitization (arrow S) and boosting (arrow B) (x-axes). Significant increases of IgE levels after boosting are indicated (*p < 0.05).

