
Figure 1.
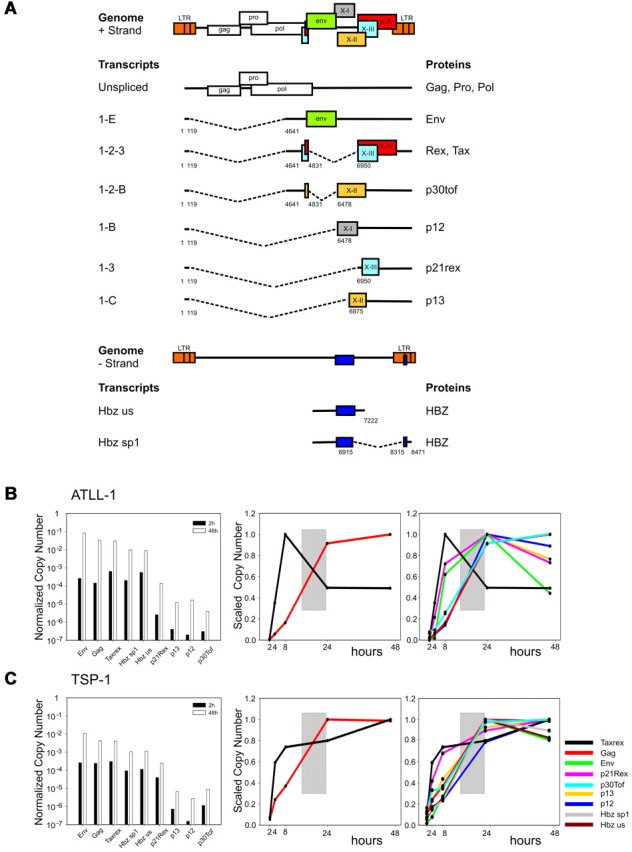
Temporal analysis of HTLV-1 expression in PBMCs from infected patients. (A) Structure and coding potential of plus- and minus-strand HTLV-1 mRNAs. (B-C) Bar graphs (left panels) show the Normalized Copy Numbers (NCN) of the indicated mRNAs after 2 hours (black bars) and 48 hours (white bars) of culture in vitro measured in representative ATLL and TSP/HAM patients; data on all patients studied are shown in supplemental Figure 1. NCN values were calculated by dividing the absolute copy number of each transcript by the absolute copy number of the 18S rRNA. Line graphs show the variation in the tax/rex and gag mRNAs (middle panels) and in all measured transcripts (right panels). Lines corresponding to HBZ mRNA are not shown for patient ATLL-1 because of insufficient material in the 8- and 24-hour time points. Scaled Copy Numbers (SCN) are plotted over a 48-hour time period (ie, at 2, 4, 8, 24, and 48 hours after depletion of CD8-positive cells and culture; cells were cultured in RPMI 1640 medium supplemented with 10% FCS, 2 mM glutamine, 100 IU/mL penicillin and 100 μg/mL streptomycin). SCN values were calculated by dividing the NCN of each transcript at each time point by the maximum NCN value measured for that mRNA during the time course experiment. mRNAs are indicated by colors as shown in panel C right.