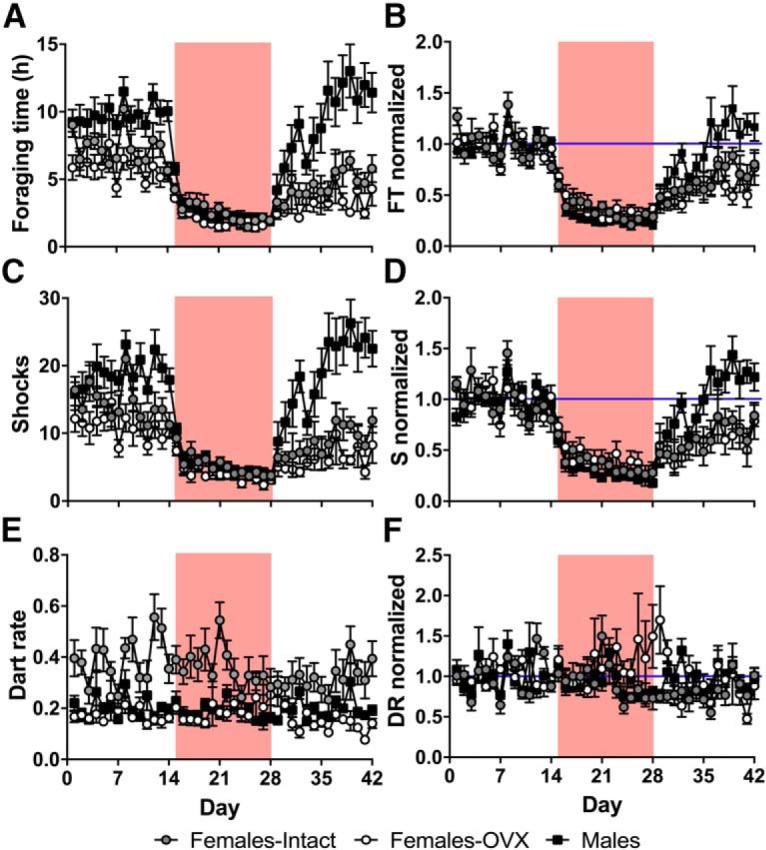
Figure 4.

Sex differences and effects of ovariectomy and footshocks on defensive behaviors. A, B, Mean daily (A) and normalized (B; percentage of baseline average) time spent in the foraging area (percentage of total time; FT); C, D, mean daily (C) and normalized (D) expected (during baseline and extinction) and actual (during shock) number of shocks received (S). E, F, mean daily (E) and normalized (F) dart rate (in darts/min; DR). Gray circles represent intact female rats (n = 8), open circles represent OVX female rats (n = 8), and black squares represent male rats (n = 8). Red background denotes shock period. All data represent the mean ± SEM.
