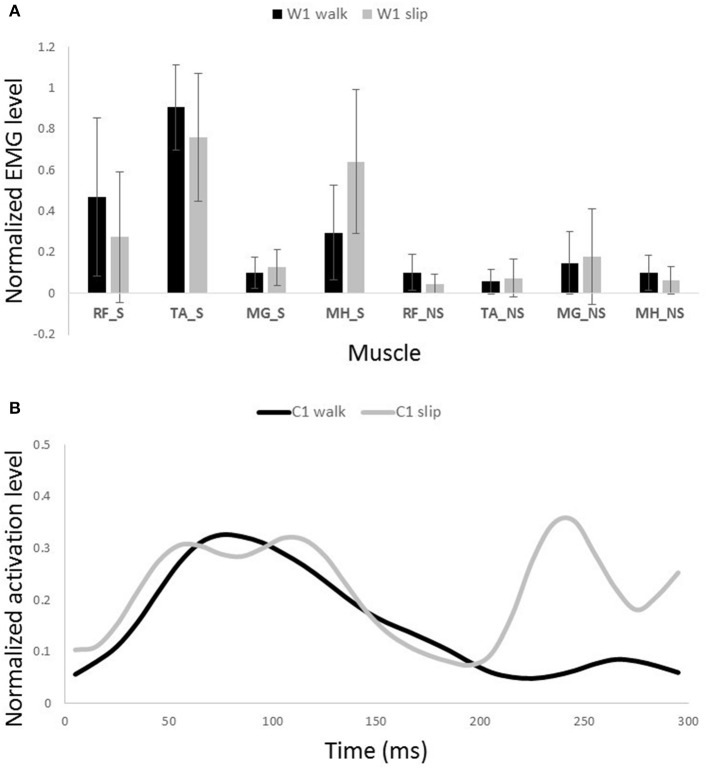
Figure 8.
Muscles synergies (A) and their corresponding time-series activation coefficients (B) for the first shared muscle synergy between normal walking and slipping. Error bars indicate one standard deviation. Note that muscles belonging to slipping foot are shown by S while muscles of non-slipping foot are shown by NS.

