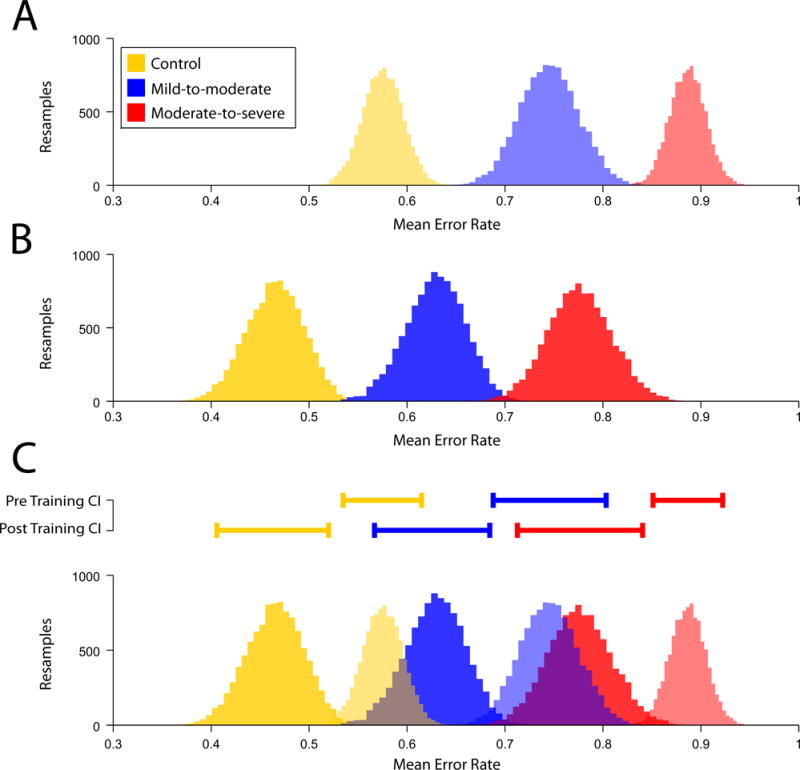
Fig 3.

Estimates of group mean error rates during SAF assessments. Estimates were generated from 10,000 resamples of the data for each group. A) Pre-training estimates of mean error rates. B) Post-training estimates of mean error rates. Note that A and B illustrate that each group are separate populations both before and after training. C) 95% confidence intervals for the pre and post-training data, and overlays of the pre and post-training data; 95% confidence intervals are presented above the distributions, illustrating significant differences between groups and sessions. Note that post-training performance for the moderate-to-severe group overlaps pre-training performance for the mild-to-moderate group, and that the post-training performance for the mild-to-moderate group overlaps pre-training performance for the healthy control group.
