
Fig 4.
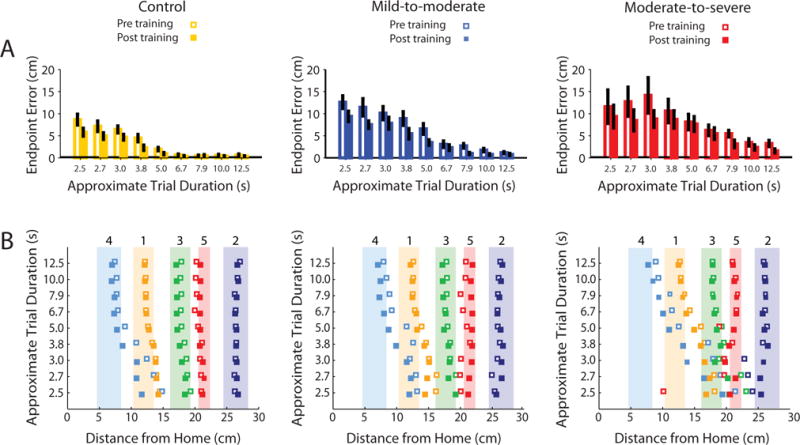
Endpoint Error magnitudes and cursor endpoint positions. A) Within group comparisons of pre and post-training endpoint errors, illustrating the significant effects of trial duration and session on performance. Error bars present SEM. B) Average cursor endpoint positions for the three groups. Squares show group average endpoints for the different targets, represented by the correspondingly colored shaded regions. Numbers above shaded regions denote target number.