Figure 1.

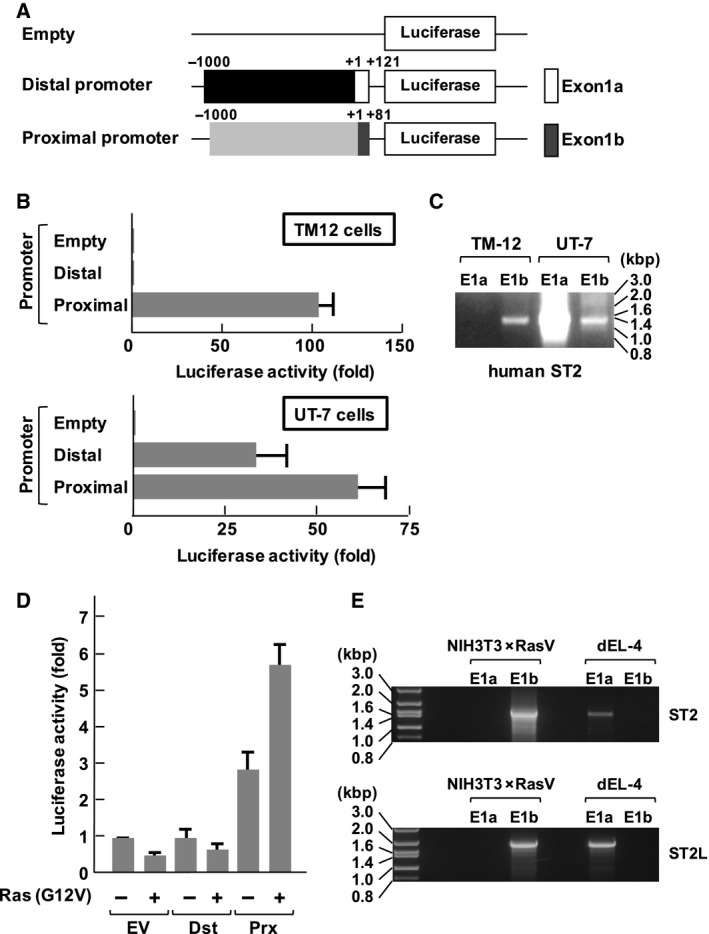
Differential usage of the distal and proximal ST2 promoters in human fibroblastic and hematopoietic cell lines. (A) The structures of luciferase vectors harboring the proximal promoters analyzed in this study are shown. An open box in the distal promoter shows the position of the distal promoter (E1a), and a gray‐colored box in proximal promoter shows the position of the proximal promoter (E1b). (B) Human fibroblasts TM12 cells and hematopoietic UT‐7 cells were transfected with the luciferase vectors shown in (A). Forty‐eight hours later, the cells were processed for reporter gene analysis. The promoter activities are shown in the graph. (C) Analysis of promoter usage of the human ST2 gene. Total RNA extracted from transformed TM‐12 and UT‐7 cells was analyzed by RT‐PCR using the primers described in the Materials and methods. The PCR products were separated on 1% agarose gels. (D) NIH‐3T3 cells were transfected with the combination of the indicated plasmids. Forty‐eight hours later, the cells were processed for reporter gene analysis. The promoter activities are shown in the graph. (E) Promoter usage of the murine ST2 gene was analyzed using total RNA extracted from transformed NIH‐3T3 × RasV and differentiated EL‐4 (dEL‐4) cells. The experiments were performed using the same method as (C). In the graph, error bar means standard deviation (SD, n = 3).
