
Figure 3.
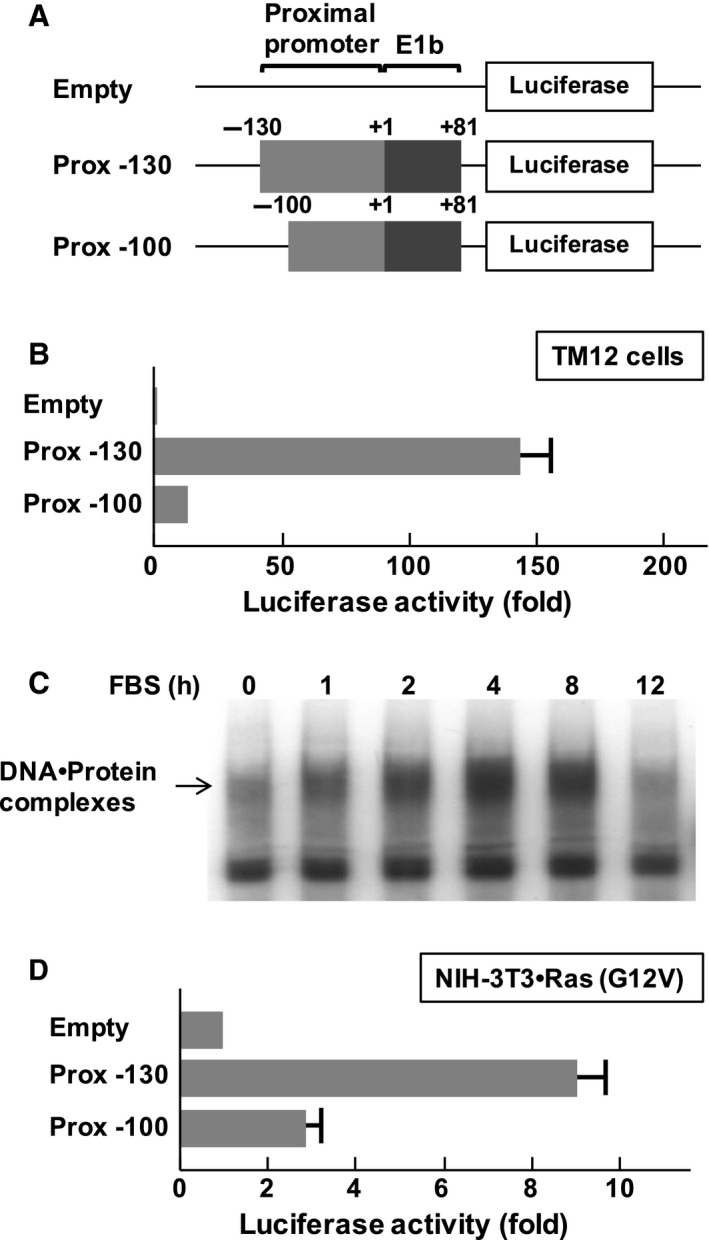
Identification of essential sequences in the ST2 proximal promoter in fibroblasts. (A) Structures of luciferase vectors analyzed in this study. Numbers indicate the position in the ST2 proximal promoter. The transcription initiation site is indicated as ‘+1’. The positions of promoter regions and E1b are indicated. (B) Human fibroblasts TM12 cells were transfected with the reporter gene plasmids. Forty‐eight hours later, the cells were harvested, and promoter activity was evaluated using luciferase assays. (C) After serum starvation, TM12 cells were stimulated with 10% fetal bovine serum for the indicated periods, and then nuclear extracts were prepared. Electrophoretic mobility shift assays (EMSAs) were performed with 32P‐labeled oligonucleotide probes containing the proximal promoter (−130 to −101). DNA–Protein complexes were separated on 5% nondenaturing polyacrylamide gels. (D) NIH‐3T3 cells were transfected with plasmids harboring Ras (G12V) and the indicated luciferase vectors. Forty‐eight hours later, the cells were processed for reporter gene analysis. In the graph, error bar means standard deviation (SD, n = 3).