Figure 4.

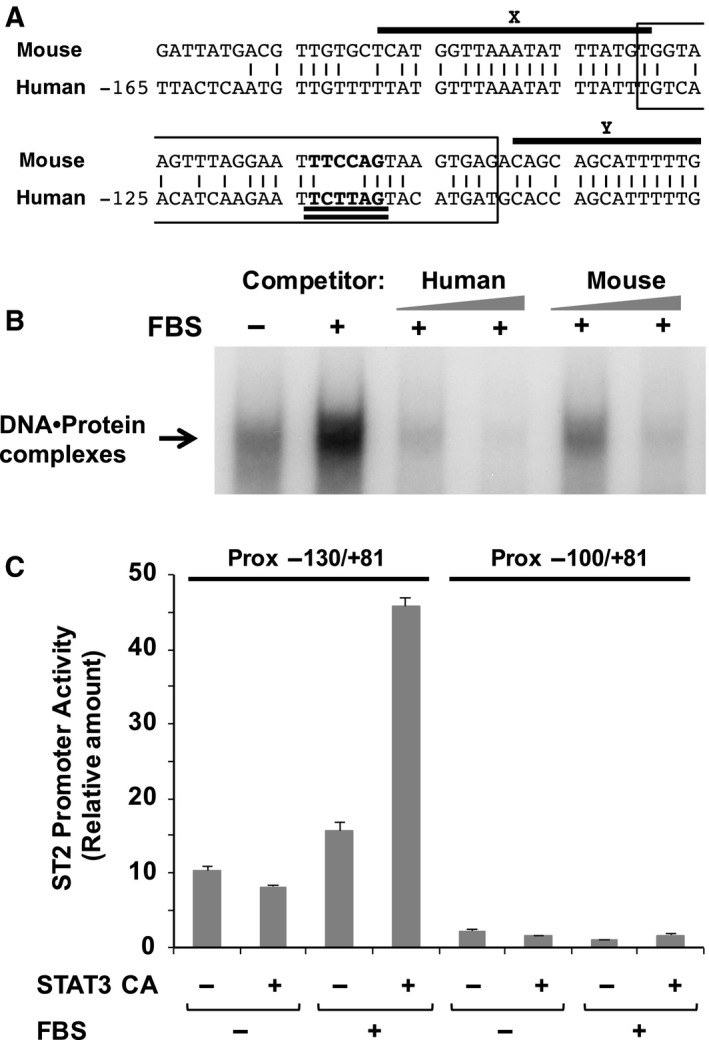
Conserved regions in the human and mouse ST2 proximal promoters. (A) The sequence similarity between the human and mouse ST2 proximal promoter is shown. The two upper‐lined sequences (X and Y) indicate the conserved regions clarified by Harr plot analysis. The boxed sequence indicates the nucleotide sequence of the probe utilized for EMSA. A possible consensus sequence for the STAT family is double underlined. (B) To show the effect of cold competitors derived from human and mouse ST2 proximal promoter on the formation of DNA–protein complexes, EMSA was performed as described in Fig. 3C and in the Materials and methods. (C) NIH‐3T3 cells were transfected with reporter gene plasmids with/without a constitutively active mutant of STAT3 (STAT3 CA). Forty‐eight hours later, the cells were harvested, and promoter activity was evaluated by performing luciferase assays. In the graph, error bar means standard deviation (SD, n = 3).
