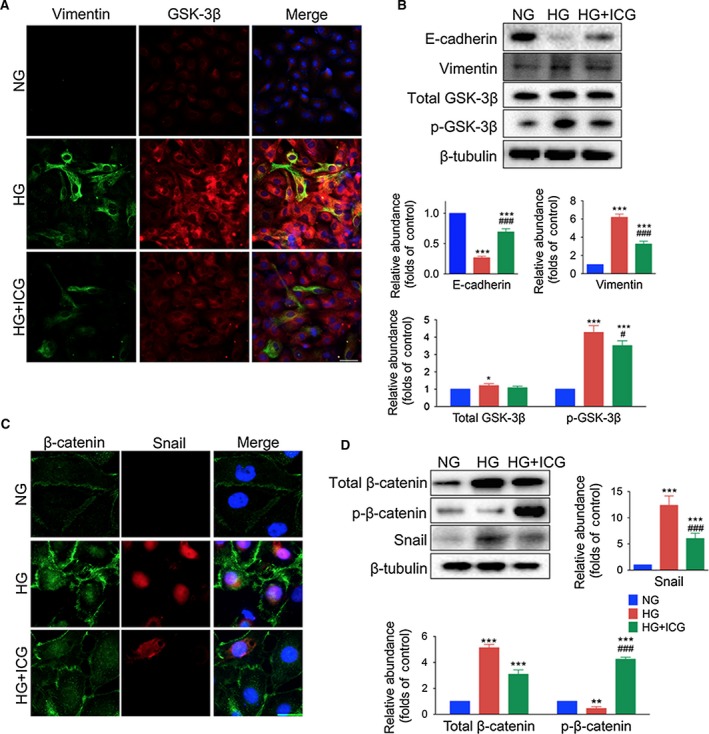
Figure 4.

ICG‐001 reverses the expression of Vimentin and E‐cadherin, reactivates GSK‐3β, and inhibits Snail expression in mPECs. (A) Images of mPECs stained with antibodies against Vimentin (green) and GSK‐3β (red), and nuclei stained with Hoechst (blue). mPECs were exposed to normal glucose (NG), high glucose (HG, 4.25% d‐glucose), or high glucose with ICG‐001 (HG+ICG, 10 μm) for 48 h (original magnification, ×200; scale bar, 100 μm). (B) Upper panel, western blots of E‐cadherin, Vimentin, p‐GSK‐3β, total GSK‐3β, and β‐tubulin in mPECs. Lower panel, statistics for expression levels of E‐cadherin, Vimentin, p‐GSK‐3β, and total GSK‐3β normalized to β‐tubulin (mean ± SD, n = 4, ***P < 0.001 and *P < 0.05 vs NG group, ### P < 0.001 and # P < 0.05 vs HG group). (C) Images of mPECs stained with antibodies against β‐catenin (green) and Snail (red), and nuclei stained with Hoechst (blue) (original magnification, ×650; scale bar, 40 μm). (D) Upper left panel, western blots of phosphorylated β‐catenin (p‐β‐catenin), total β‐catenin, and Snail in mPECs. Other panels, expression levels of p‐β‐catenin, total β‐catenin and Snail normalized to β‐tubulin (mean ± SD, n = 4, ***P < 0.001 and **P < 0.01 vs NG group, ### P < 0.001 vs HG group).
