
Figure 11.
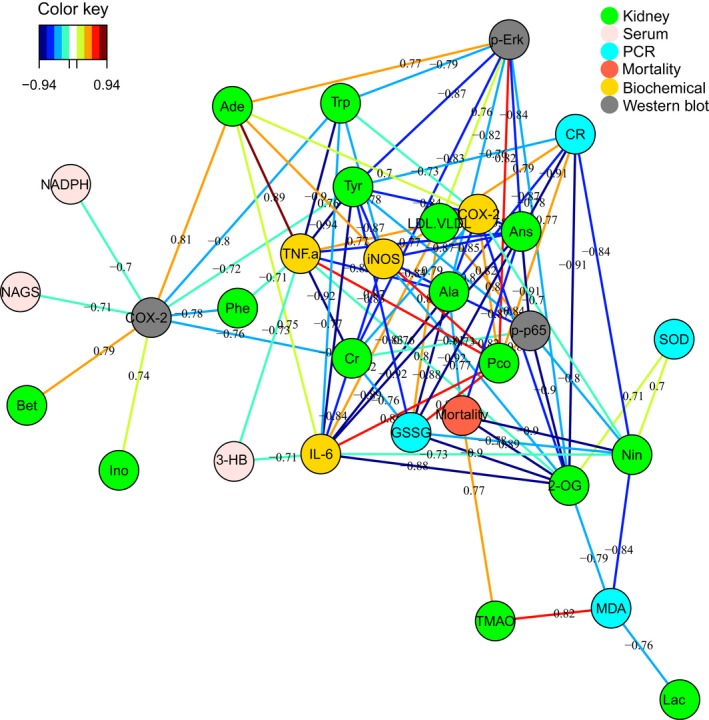
Correlation network determined by canonical (sparse‐partial least‐squares, sPLS) analysis using metabolite concentrations as x variables and other parameters as y variables. The network is graphically represented with NC, LPS, HLJDD, RC, RS, CP, FG, and biochemical parameters (framed in circles), gene expressions detected by PCR (framed in circles), protein expressions detected by western blot (framed in circles), mortality (framed in circles), and metabolites (framed in rectangles) as nodes, and correlations above a threshold (0.7) as edges (color‐coded according to the correlation coefficients, blue for negative and red for positive correlations).