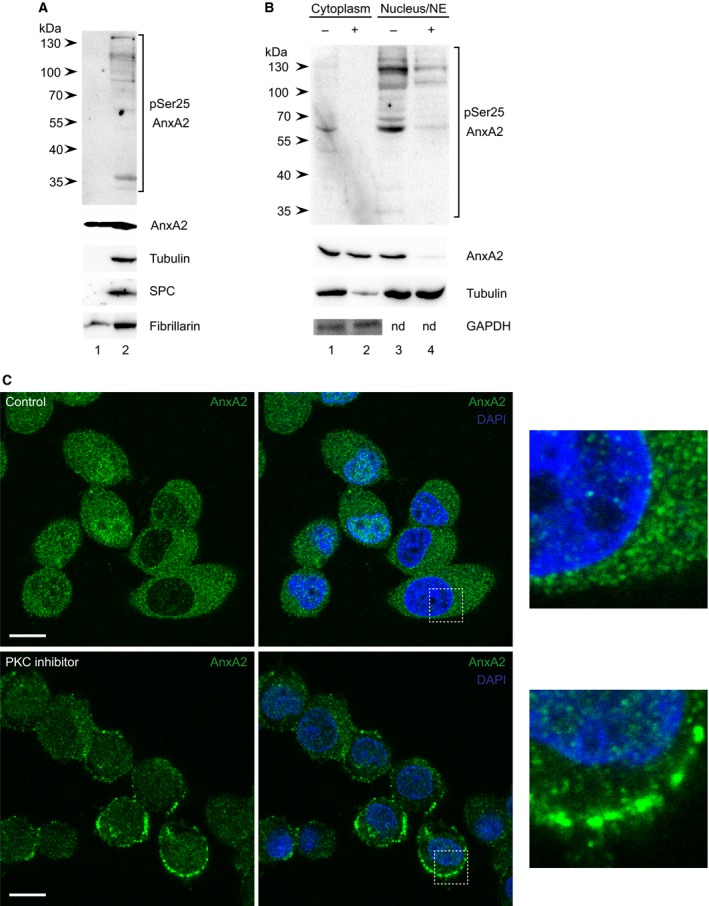
Figure 2.

Distribution of pSer25AnxA2 in nuclear subfractions of PC12 cells (A). Proteins (100 μg) from the nucleoplasm (lane 1) and NE (lane 2) fractions were separated by 10% SDS/PAGE and subjected to western blot analysis. The blot was probed with antibodies against pSer25AnxA2, total AnxA2, tubulin, SPC and fibrillarin, as indicated. myr‐ψ‐PKC inhibits Ser25 phosphorylation of AnxA2 and shifts the localisation of AnxA2 from the perinuclear to the cortical region of PC12 cells (B, C). Proteins (100 μg) from the cytoplasmic (lanes 1 and 2) and nuclear (lanes 3 and 4) fractions prepared from myr‐ψ‐PKC‐treated (+; lanes 2 and 4) and control (−; lanes 1 and 3) cells were separated by 10% SDS/PAGE and subjected to western blot analysis (B). The blots were probed with antibodies against pSer25AnxA2, total AnxA2, tubulin and GAPDH, as indicated. Detection of the resulting protein bands (A, B) was performed using the ChemiDoc™ XRS+ molecular imager after incubation with HRP‐conjugated secondary antibodies and ECL reagent. The arrows to the left indicate the protein molecular mass standards (nd, not determined). Immunofluorescence staining of control and myr‐ψ‐PKC‐treated cells, as indicated, was carried out using rabbit polyclonal antibodies against AnxA2 (green) (C). DNA staining with DAPI (blue fluorescence) was included to visualise the nucleus. Scale bar is 10 μm. The insets show higher magnification of the indicated areas in the images shown to the right in Panel (C).
