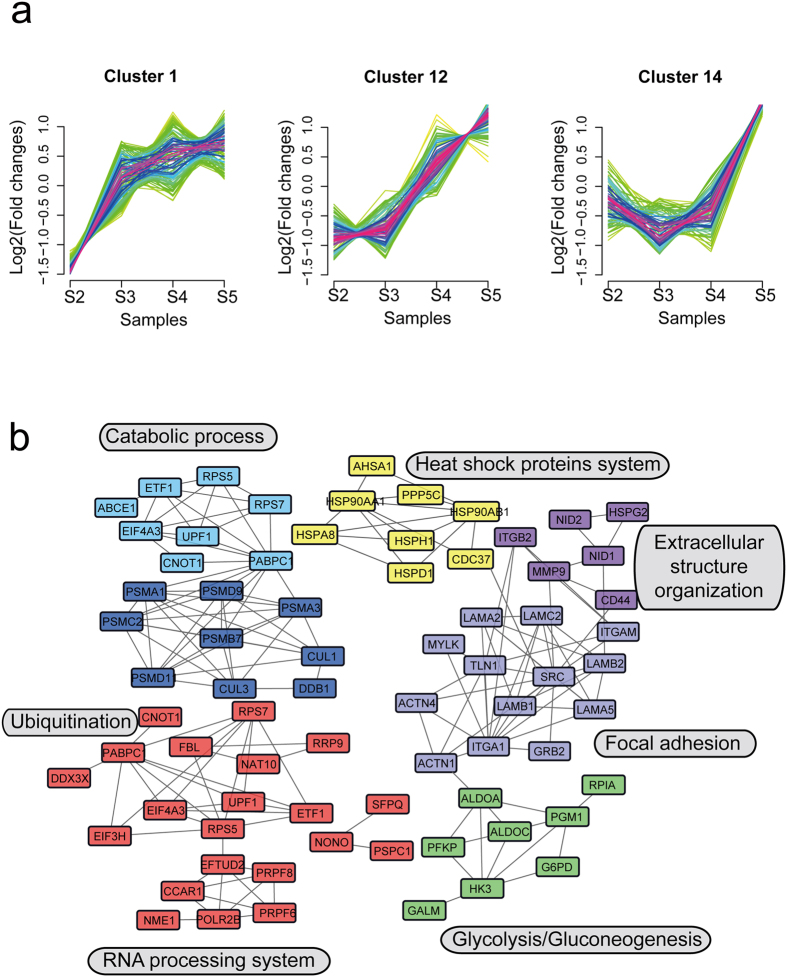
Figure 3. Increased fold-change protein dynamic clusters in gastric cancer development.
(a) Expression pattern of three increased fold-change protein dynamic clusters. (b) The protein-protein interaction network of three increased fold-change protein dynamic clusters. Nodes stand for individual proteins, lines connecting to proteins stand for the correlation between them, and different colors represent different protein functional clusters. Network analyses were performed based on STRING database (http://string-db.org/).

