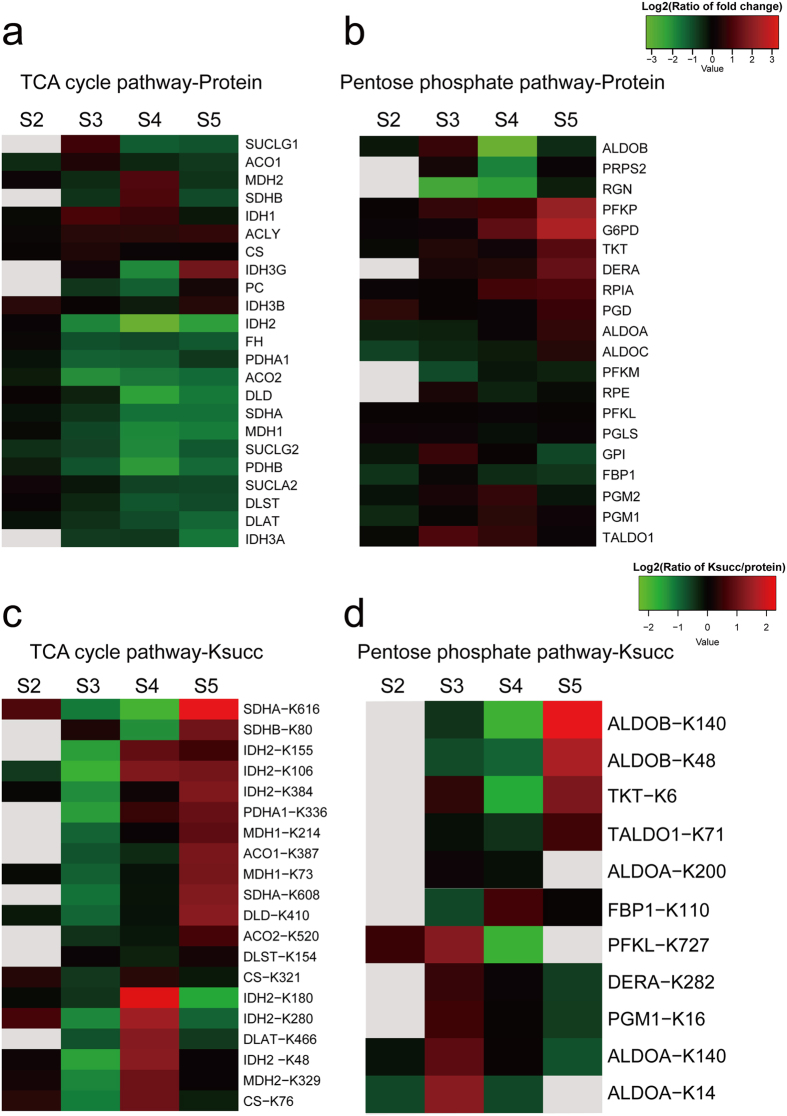
Figure 6. Proteins and Ksucc expression profile in the TCA cycle and pentose phosphate pathway in gastric cancer.
(a) Protein expression profile in the TCA cycle. (b) Proteins expression profile in the pentose phosphate pathway. (c) Ksucc expression profile (normalized against protein level) in the TCA cycle. (d) Ksucc expression profile (normalized against protein level) in the pentose phosphate pathway. Color gray represents no quantitative data in this specific term.

