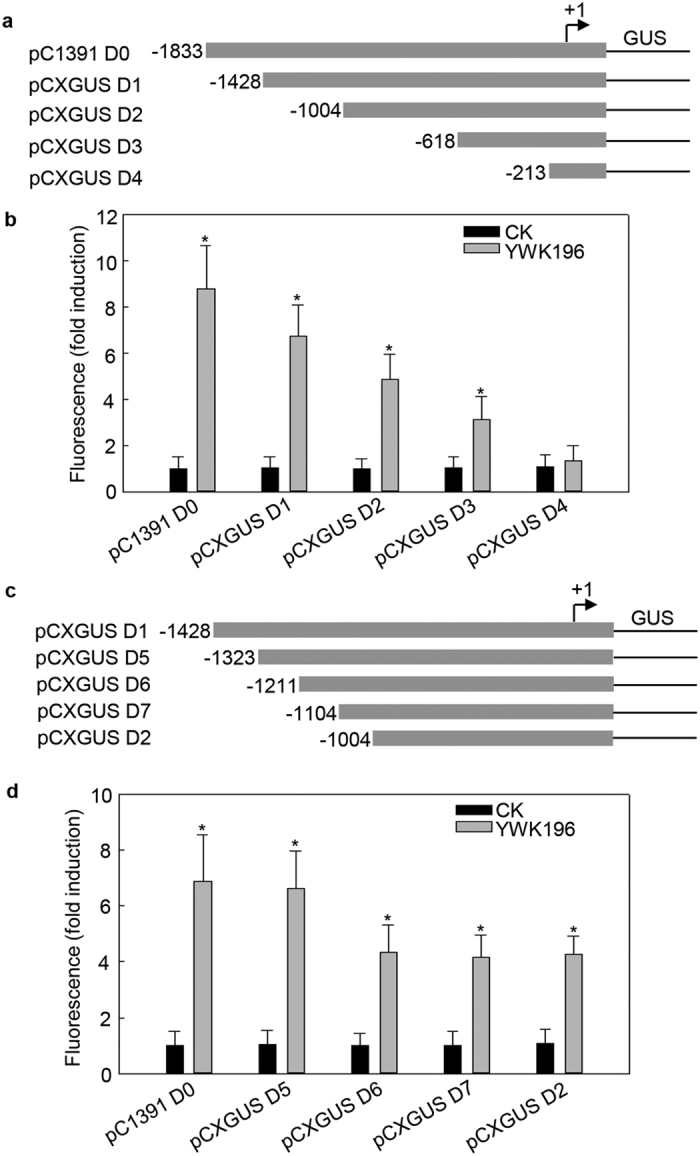
Figure 3. Quantitative fluorometric assays for GUS activity driven by various GRMZM2G315431 promoter deletion constructs.

(a) Diagram of various deletion derivatives of the GRMZM2G315431 promoter. The deletion end points are indicated in bp from the transcription start site. All promoter derivatives were fused to a GUS reporter vector, pCXGUS-P. (b) The GUS activity of the DNA constructs prepared in (a) in a tobacco transient expression system. The tobacco leaves were inoculated with R. solani strain YWK196 for 24 h. GUS activity was calculated relative to CK of the pC1391 D0 construct. (c) Diagram of the deletion constructs in the −1428 to −1004 region of the GRMZM2G315431 promoter. All promoter derivatives were fused to a GUS reporter vector, pCXGUS-P. (d) The GUS activity of DNA constructs prepared in c in a tobacco leaf transient expression system. The tobacco leaves were inoculated with R. solani strain YWK196 for 24 h. GUS activity was calculated relative to CK of the pCXGUS D1 construct. Error bars indicate the SD (n = 3). Asterisks indicate P < 0.05 (*) in Student’s t test analysis.
