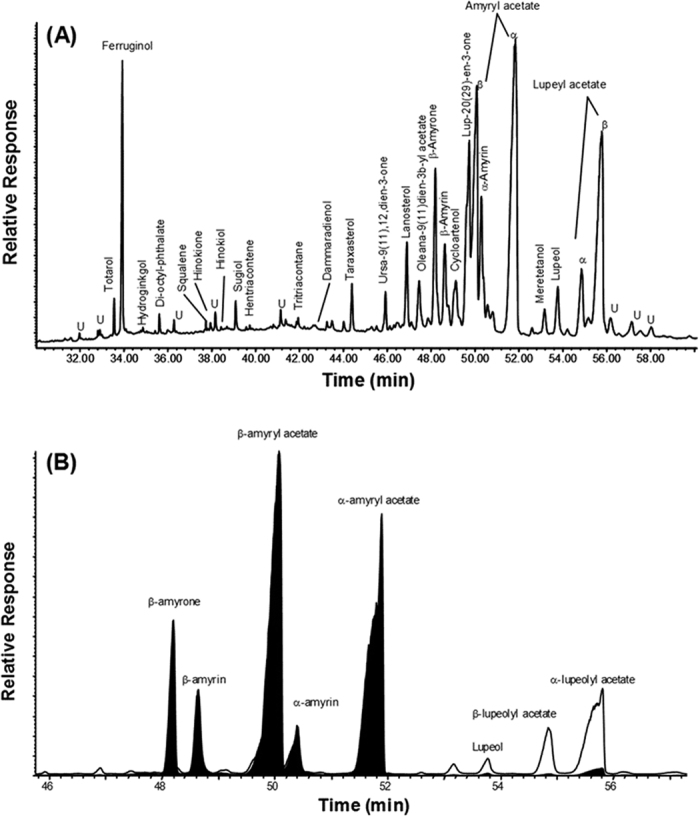
Figure 6. GC-MS analysis of L-Acetate fraction.

(A) Total ion current (TIC) traces showing the major organic compounds. (B) Examples of typical GC-MS key ion plots (m/z 189/218) for triterpenoids (U = unknown).

(A) Total ion current (TIC) traces showing the major organic compounds. (B) Examples of typical GC-MS key ion plots (m/z 189/218) for triterpenoids (U = unknown).