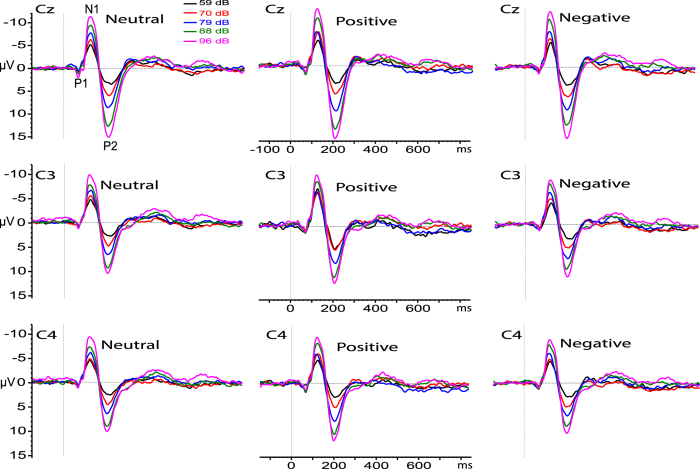
Figure 1. Grand average ERPs obtained on 39 participants at recording sites C3, Cz, and C4, for five different tone intensities delivered during the presentation of neutral, positive and negative pictures.
The ERP components P1, N1 and P2 are indicated for auditory intensities of 59, 70, 79, 88, 96 dB SPL.

