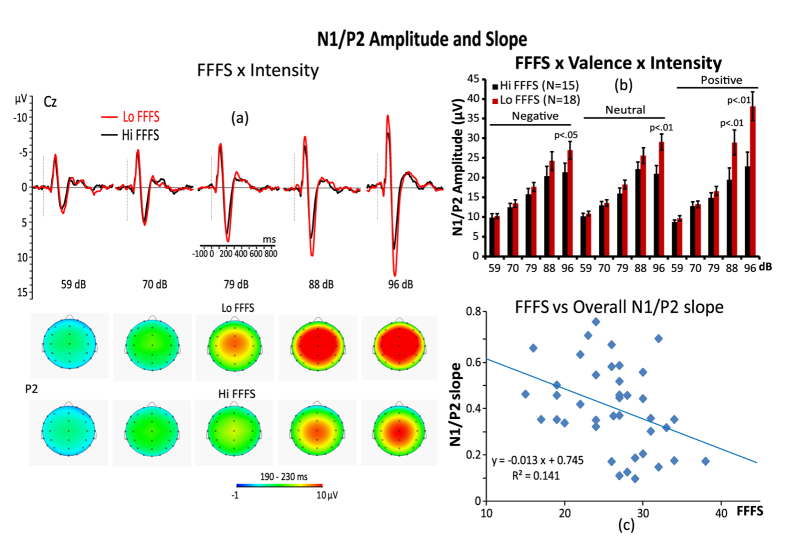
Figure 3.
(a) Grand average midline ERP responses and scalp maps of P2 amplitude for 5 tone intensities (59, 70, 79, 88, 96 dB SPL) in high and low FFFS participants (left panel). (b) Histogram in the upper-right panel is displaying the interaction of FFFS, Valence of the picture, and Intensity of the tone on overall N1/P2 amplitude. (c) Scatterplot in the bottom-right panel shows the relationship between FFFS and overall N1/P2 slope.

