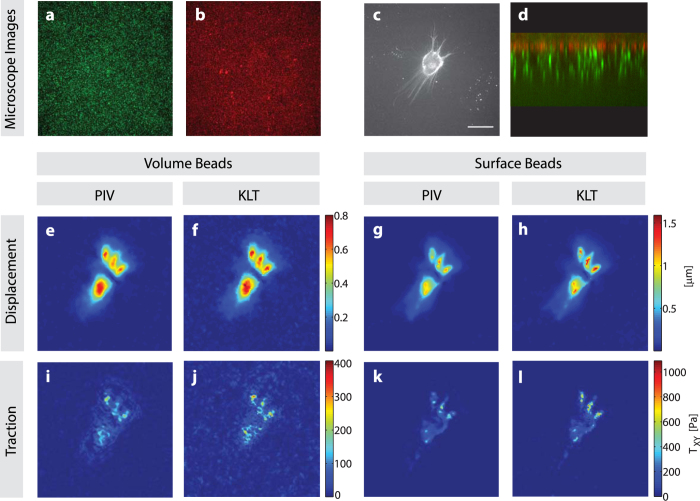
Figure 10. Experimental TFM of a HuO9 cell cultured on top of a polyacrylamide gel with two different bead distributions, and analyzed using two different displacement field algorithms.
(a) Volumetric bead distribution in the green channel, (b) Beads bound on the surface in red channel, (c) HuO9 labeled with the lipophilic dye DiD and (d) Image composite of the two bead layers in orthogonal view (x-z axis). (e–h) Absolute displacements in μm, analyzed using PIV (e,g) and KLT (f,h) for the volume beads (e,f) and surface beads (g,h). (i–l) Absolute Traction fields in Pa as obtained using PIV displacements (i,k) and KLT (j,l) for volume beads (i,j) and surface beads (k,l). Scale bar represents 30 μm.

