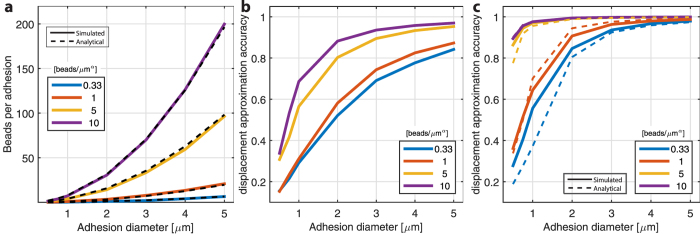
Figure 7. Spatial metrics related to the simulated random distribution of beads in both volumetric and surface bound configurations.
(a) In both cases, the average number of beads beneath an area of a focal adhesion was evaluated (solid line) shown for volumetric distribution, n = 20; dashed line: Analytical solution per equation (1). (b) The bead displacement approximation accuracy of the bead displacement simulation as a function of bead density, shown for the volumetric configuration. This measure is defined as the ratio between the maximum displacements in the FEA simulation to the maximal bead displacement. (c) Bead displacement approximation accuracy of the surface bound distribution. Dashed lines represent the analytical solution. For a similar number of beads covered by the focal adhesion, the displacement field is better represented on the surface than the volumetric configuration. In actual TFM measurements, bead marker displacements are used to estimate the true displacement caused by the cell. Therefore, this ratio indicates the ability for a given bead distribution to yield an accurate reconstruction of true displacement.

