Figure 2.
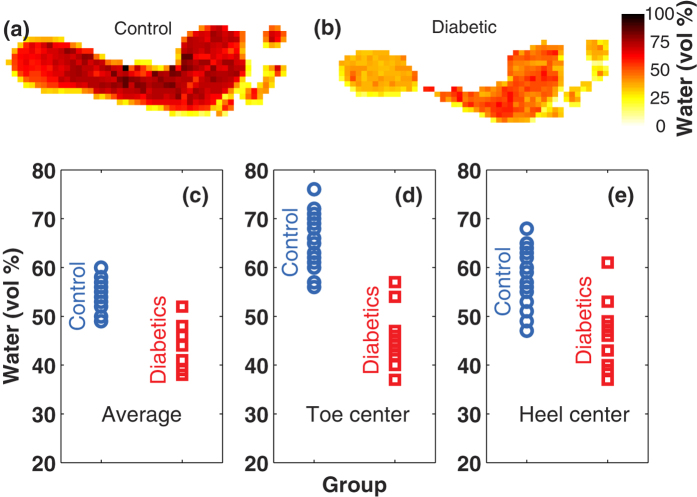
(a) Terahertz image of a typical member of the control group. (b) Terahertz image of a typical member of the diabetic group. Volumetric fraction of water for control group members and diabetics (c) averaged over the foot sole, (d) at the center of the greater toe and (e) at the center of the heel. Each point represents a subject.

