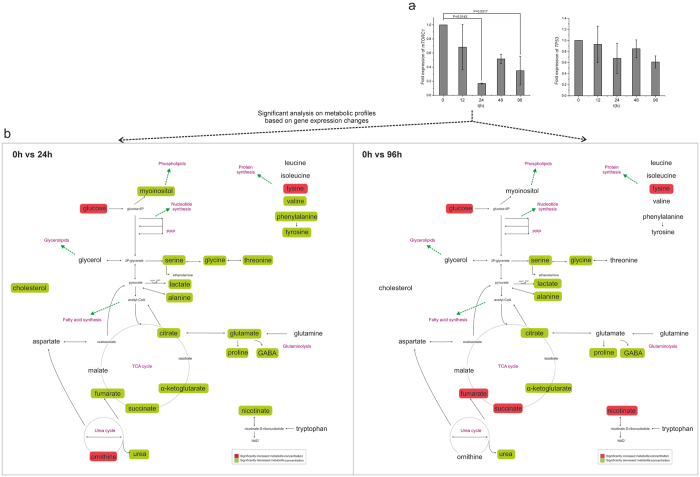
Figure 5. Expression of mTORC1 and tp53 in hESCs exposed to ROCK inhibitor and on-network representation.
(a) mTORC1 expression is significantly reduced at 24 h and 96 h compared with that at 0 h in hESCs (p < 0.05), whereas expression of tp53 is unchanged throughout culture (expressions always relative to 0 h). (b) Reduction of mTORC1 expression correlated with significant decreases in the concentration of metabolite pools at 24 h compared to 0 h and a further decrease at 96 h. The comparisons applied were chosen accordingly to the significant changes on gene expression.

