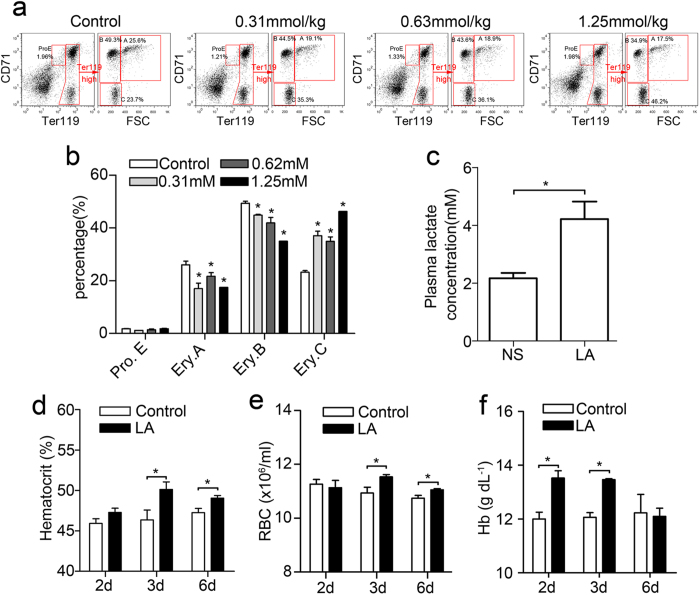
Figure 3. Bone marrow erythropoiesis promoted by physiological concentrations of lactic acid in vivo.
(a) Representative flow cytometric profiles of BM cells from lactic acid-treated or normal mice at 48 hours. (b) Summary of the percentage of the populations shown in panel a. The data represent the mean ± S.E.M. of mice (n = 3). *P < 0.05 vs. their respective controls. (c) The plasma lactate levels 10 minutes after intraperitoneal injection of 1.25 mmol/kg lactic acid. The data represent the mean ± S.E.M. *P < 0.05. (d–f) The haematocrit, red blood cell counts and haemoglobin levels in the blood 2, 3 and 6 days after NS or 1.25 mmol/kg lactate infusion. The data represent the mean ± S.E.M. *P < 0.05 vs. their respective controls.

