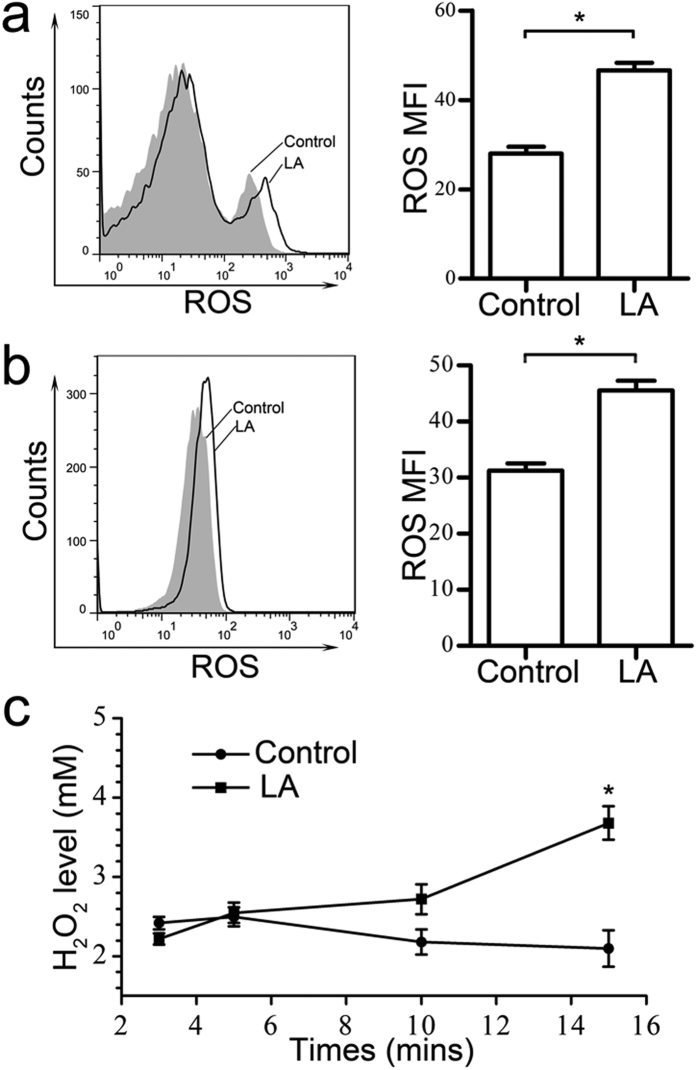
Figure 4. Increased ROS production in the BM cells and K562 cells treated with lactic acid in vitro.
BM cells (a) and K562 cells (b) were treated with lactic acid for 6 hours and then pre-loaded with 10 μM DCFH-DA. DCF fluorescence was measured via flow cytometry. The black curves indicate lactic acid-treated K562 cells or BM cells, and the grey curves indicate untreated cells. MFI analyses are shown to the right. The data represent the mean ± S.E.M. (n = 3). *P < 0.05. (c) Enhanced production of H2O2 was observed in the K562 cells 15 minutes after the 10-mM lactic acid treatment. The data represent the mean ± S.E.M. *P < 0.05.

