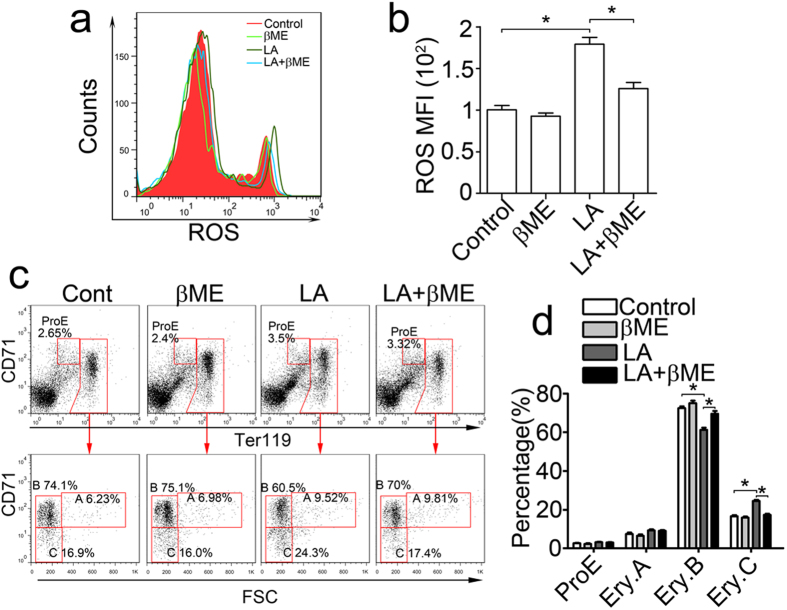
Figure 5. Lactic acid-enhanced erythropoiesis of mouse BM cells was inhibited by antioxidants.
(a,b) BM cells stimulated with 5-mM lactic acid or 50-μM β-ME for 6 hours were analysed via flow cytometry for ROS production using DCFH-DA probes. (a) β-ME treatment inhibited the increased ROS production of BM cells in the lactic acid-treated group. The red curve indicates cells treated with the medium, the light green curve indicates cells treated with β-ME, the dark green curve indicates cells treated only with lactic acid, and the blue curve indicates cells treated with both lactic acid and β-ME. (b) MFI analyses are shown. The data represent the mean ± S.E.M. *P < 0.05. (c,d) Erythroid differentiation of BM cells promoted by lactic acid was inhibited by β-ME. (c) The cells were stained with CD71 and Ter119 antibodies and analysed via flow cytometry 2 days after 5-mM lactic acid and 50-μM β-ME stimulation. (d) The percentage profile of the populations in panel c. The data represent the mean ± S.E.M. *P < 0.05.

