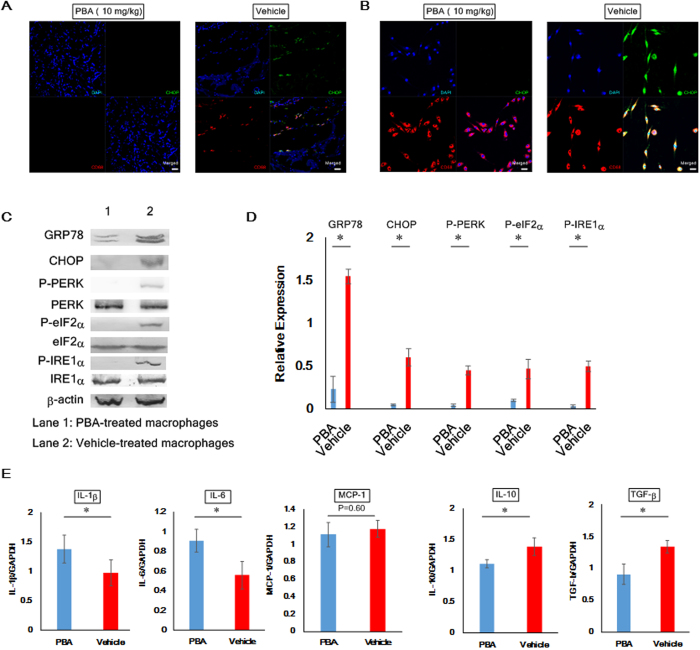
Figure 6. Mitigation of cGVHD-caused ER stress in macrophages by the use of PBA.
(A) Immunofluorescence images of the PBA- and vehicle-injected lacrimal glands. Macrophages and CHOP are stained red and green, respectively. The pictures were taken at 200x magnification, and the scale bar is 20 μm. (B) Immunofluorescence images of cultured splenic macrophages from the PBA- and the vehicle-dosed mice. Macrophages and CHOP are stained red and green, respectively. The photographs were taken at 200x magnification, and the scale bar is 20 μm. (C) Immunoblot analysis of ER stress markers in murine splenic macrophages. (Lane 1: Splenic macrophages from PBA-dosed mice, Lane 2: Splenic macrophages from vehicle-dosed mice) Cropped blots are displayed. (D) The corresponding quantitative analysis of each protein band. PBA-treated macrophages (blue) and vehicle-treated macrophages (red). Data from one of two similar experiments are shown. The data are shown as means, ±SD, PBA: n = 4, Vehicle n = 4, *P < 0.05. (E) qPCR analysis of markers for M1 and M2 macrophages from the spleens. PBA-treated macrophages (blue) and vehicle-treated macrophages (red). Data from one of two similar experiments are shown. The data are presented as means, ±SD, PBA: n = 4–5, Vehicle n = 4–5, *P < 0.05.

