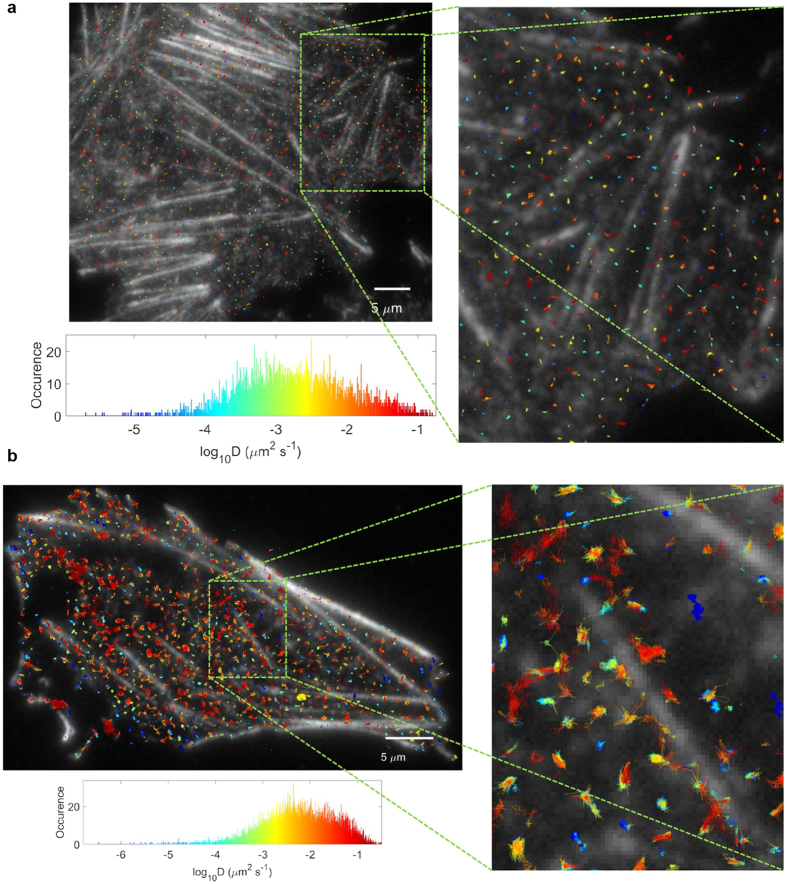
Figure 6. Cholesterol increases ABCG1 diffusion.
(a) Example of control sample ABCG1 trajectories in control cells, colour coded by the magnitude of the diffusion coefficient (blue to red for increasing D, see histogram) and superimposed on the image of phalloidin-labeled actin. (b) Example of trajectories for ABCG1 in cholesterol-loaded CHO-K1 cells. The mean square displacement for each ABCG1 trajectory was calculated and fitted linearly for the first 5 temporal lags, in order to obtain a diffusion coefficient per trajectory. The membrane sheets were imaged at 26 °C.

