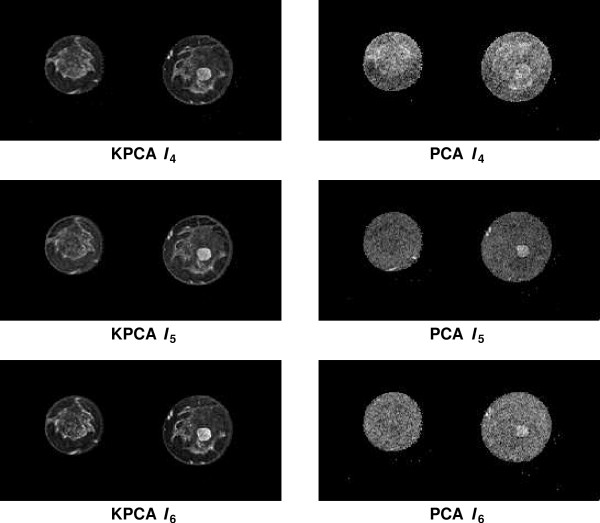
Figure 11.
Fusion images I4, I5 and I6 for S3 based on the PDs with the fourth, fifth and sixth largest eigenvalue. The left column shows the fusion images based on KPCA. Each fusion image was calculated with a bandwidth that was individually optimised according to the Fisher score. The right column shows the same images fused with PCA. In contrast to the KPCA based fusion images, these images show a significant fraction of high frequent noise and less details.

