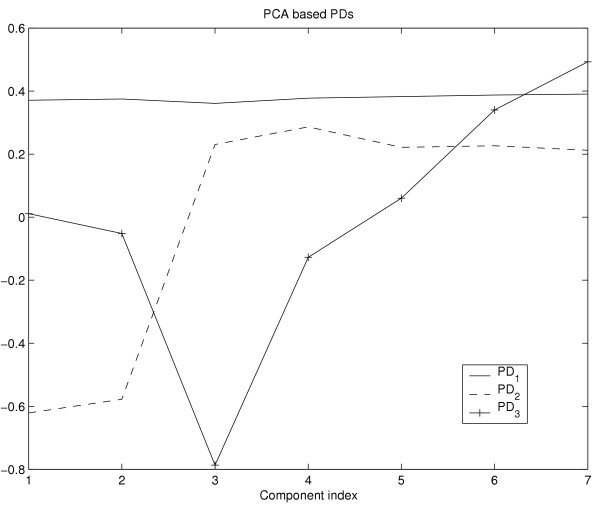
Figure 13.
Plot of the components of the vectors PD1 (solid), PD2 (dashed) and PD3 (solid with crosses) based on the PCA algorithm. The plot of PD2 shows a typical signal of suspicious tissue (see Fig. 3) and therefore leads to discriminative fusion images with high intensity values at positions of tissue that exhibits a significant signal uptake after injection of the contrast agent.

