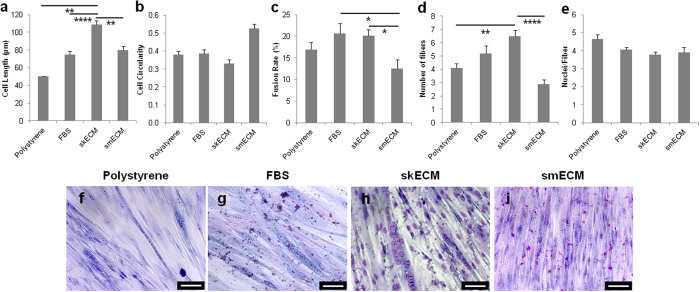
Figure 5. Evaluation of cell morphology and fiber formation on urethra ECM coatings.
(a) Cell length (μm) and (b) circularity were determined for a total of 60 cells per condition. (c) Fiber formation (n = 10 HPF) was evaluated through fusion rate (%), (d) number of fibers and (e) number of nuclei per fiber. Results as mean ± SEM, *p ≤ 0.05, **p ≤ 0.01, ****p ≤ 0.0001, all others are not significant, p > 0.05, ANOVA. (f–i) Giemsa stainings were used to quantify fiber formation. Scale bar: 50 μm.

