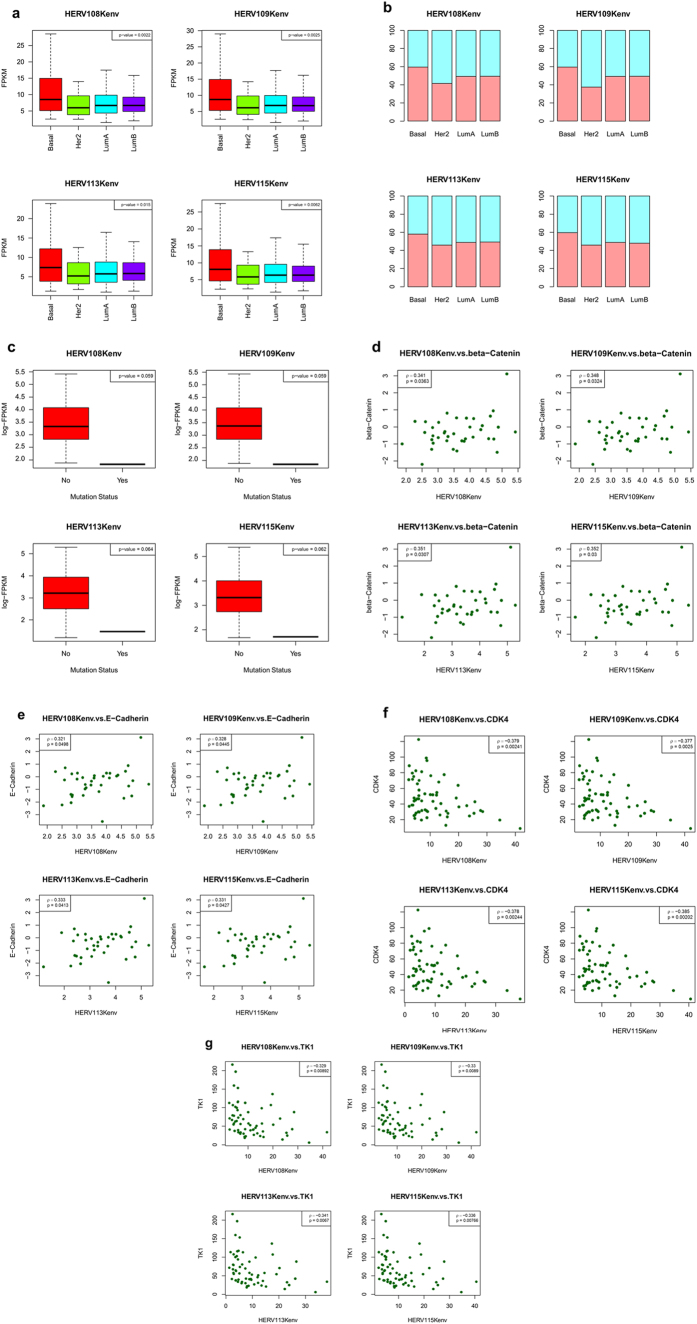
Figure 5. TCGA analysis of expression of HERV-K and cell signaling mRNAs in ILC/other human breast tumors.
Expression of HERV-K env mRNA (a) and HERV-K expression percent by subtype, expressed as the percentage of samples in each subtype above the FPKM median for all subtypes (b) (for both (a) and (b): Basal, n = 62; Her2, n = 24; LumA, n = 315; LumB, n = 77). The association of increased expression of HERV-K with decreased mutation of wild-type H-Ras (c) (n = 53), and scatterplots showing associations between HERV-K expression and abundance of β-catenin (d) (n = 38), E-cadherin (e) (n = 38), CDK4 (f) (n = 62), and thymidine kinase 1 (TK1) (e) (n = 62).

